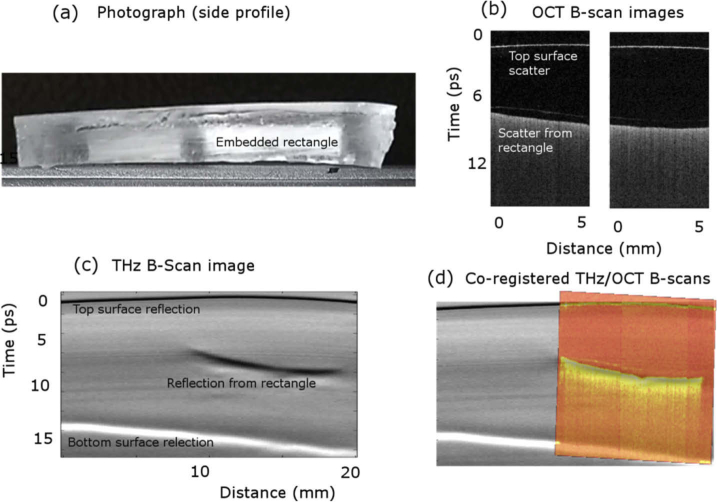
Fig. 6.
(a) Side-view photograph of the test object showing the embedded rectangular test object. THz and OCT were incident on the top surface. (b) OCT B-scan image, along the profile shown by the red dotted line in Fig. 1, showing a reflection from the top surface of the test object and increased scatter from the embedded rectangle. (c) B-scan THz image showing reflections from the top surface of the test object, the top surface of the embedded rectangle, and the bottom surface of the test object. (d) The co-registered overlay of the THz and OCT B-scan images showing the agreement between the two imaging methods, where the OCT image is in ‘hot’ colourmap for contrast.

