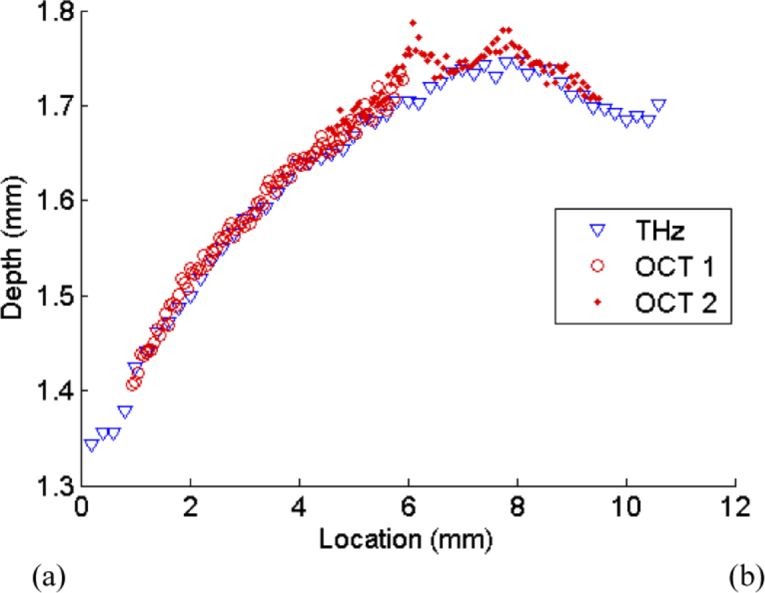
Fig. 7.

(a) Graph showing the depth of the embedded rectangle along the profile marked in Fig. 1 with a red dotted line. The depth of the layer identified from the THz image is shown as blue triangles, while the depth obtained with OCT images is shown as red circles. ‘OCT 1’ represents the data from the left hand OCT image in Fig. 6(b), while ‘OCT 2’ represents the data from the right hand OCT image
