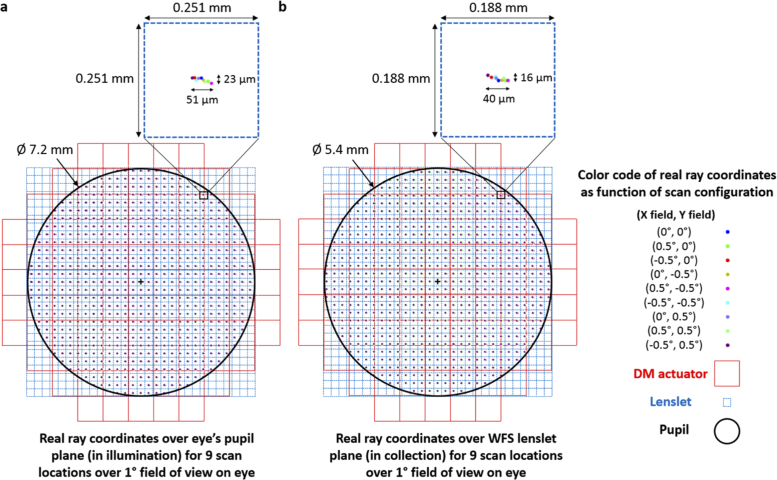
Fig. 5.
Footprint diagrams show the real ray coordinates over the eye’s pupil (a) and WFS lenslet plane (b) for 9 scan locations spanning a 1° square FOV on the eye. A magnification-corrected image of the system’s pupil, lenslet array, and DM actuator array are overlaid on top of the footprint diagrams revealing that the wavefront measurement is mainly limited by the sampling density dictated by the WFS’s lenslet array rather than the combination of other effects such as pupil aberrations, distortion, and wobble in the illumination and collection paths. The sampling density of the real ray coordinates for the footprint diagrams was chosen to roughly correspond to the magnification-corrected lenslet spacing at the conjugate planes shown in a-b). Magnified insets of a lenslet to the top right of the pupil (where the optical aberrations are worst) are shown at the top right of (a) and (b).

