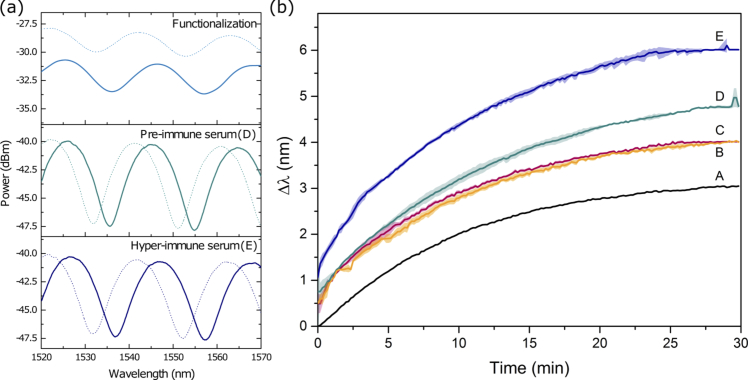
Fig. 5.
(a) Spectral response of the fabricated end-capped sensor at different stages of the immunoassay: functionalization with antigenic lipids and immersion in Pre-immune and Hype-immune sera. The dashed and the continuous lines represent the first and last acquired interference pattern, respectively. (b) Wavelength shift during detection of antigen-antibody binding on PDMS. Curves A, B and C show the performance of untreated (i.e., without the lipid antigen) sensors during incubation in PBS (T=37 °C) (A), control (B) and specific antibody-containing Hyper-immune (C) sera from lipid-immunized rabbits . Curves D and E were obtained with functionalized sensors immersed in (D) and (E) sera (see text for details). The shadows on the curves represent the standard deviation from triplicate measurements.

