Fig. 1.
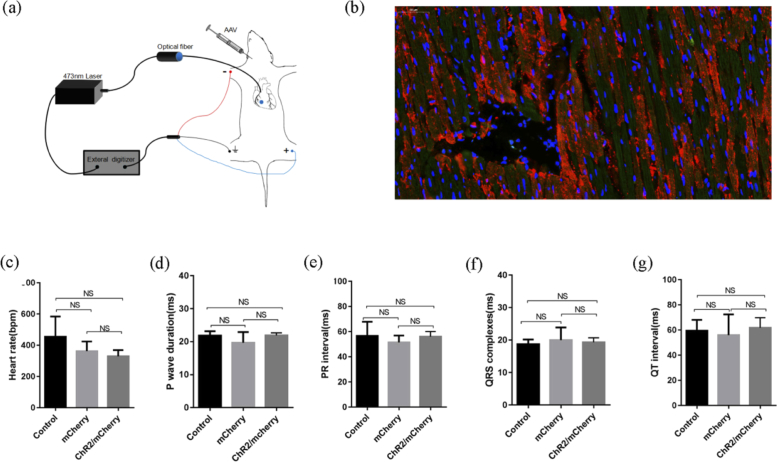
ChR2-mCherry expression and electrophysiological characterization in cardiac optogenetics rat model. (a) Scheme of ChR2 virus vector delivery and 473-nm laser illumination for model verification. (b) ChR2 expressed in fusion with the mCherry fluorescence image in ventricles (red, ChR2; green, cardiomyocytes; blue, nuclei; scale bars, 50 µm). (c-g) Baseline ECG parameters in ChR2/mCherry, mCherry and control rats. P wave duration: ChR2/mCherry, 21.92 ± 0.77 vs. mCherry, 19.67 ± 3.27 vs. control, 21.86 ± 1.30, in ms; PR interval: ChR2/mCherry, 56.06 ± 4.07 vs. mCherry, 51.50 ± 5.46 vs. control, 56.72 ± 11.21, in ms; QRS duration: ChR2/mCherry, 19.31 ± 1.40 vs. mCherry, 20.03 ± 3.88 vs. control, 18.75 ± 1.44, in ms; QT interval: ChR2/mCherry, 61.89 ± 7.97 vs. mCherry, 56.03 ± 16.40 vs. control, 59.58 ± 8.59, in ms; n = 6; The data are presented as the mean ± SEM. NS, not significant, P > 0.05; one-way ANOVA/Bonferroni (c, e-g) and non-parametric Kruskal-Wallis test (d).

