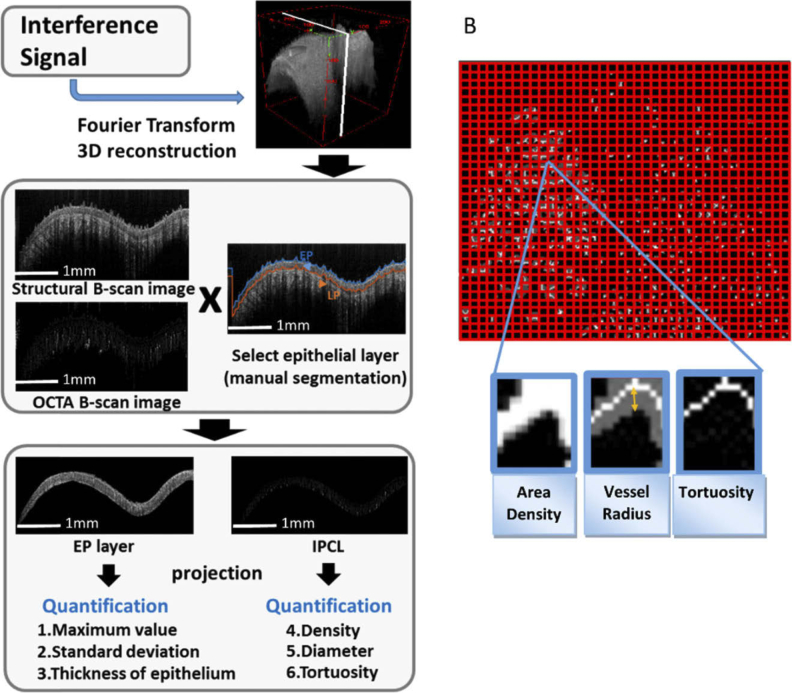
Fig. 2.
Analysis of OCT image. (A) Flow chart of image processing and quantitative analysis: manual segmentation was performed to select the epithelium layer; then, three quantitative parameters from the structural image and three parameters from the OCTA image (IPCL) were analyzed. (B) Definition of IPCL parameters: vessel area density (ratio): area of vessels (white area) / entire area (window size 30×30 pixels); average vessel radius (number of pixels): distance from vessel margin to central skeleton (orange double arrow) (window size 30×30 pixels); tortuosity: entropy calculated from the skeletonized vessel map (window size 10×10 pixels).

