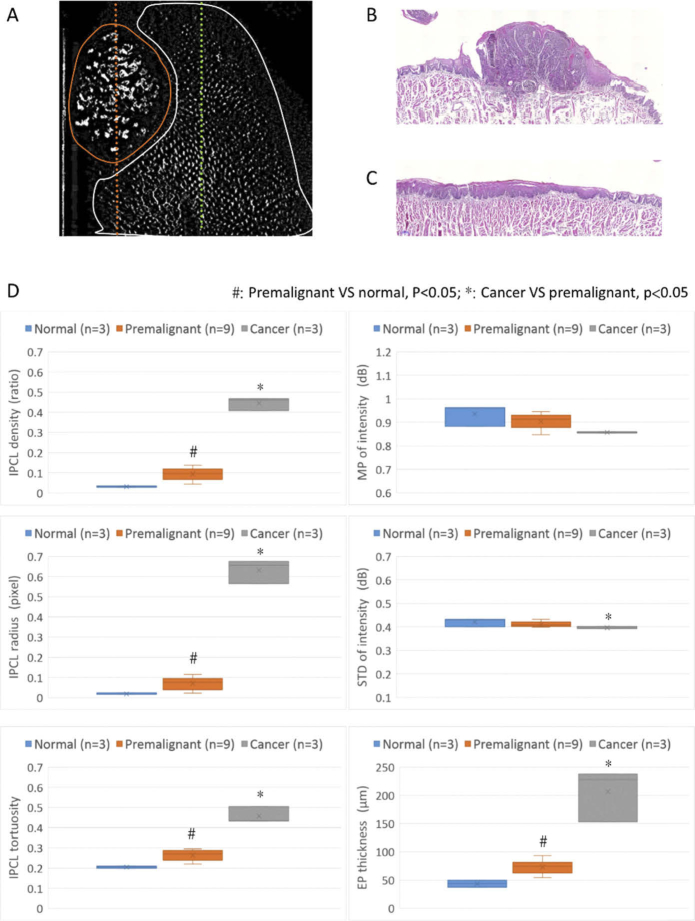
Fig. 4.
Diagnostic ability of different quantitative parameters. (A) En-face IPCL image: the area circled by the orange line was labeled as cancerous area, and the histology corresponding to the orange dotted line showed SCC (B); The area circled by the white line was labeled as premalignant area, and the histology corresponding to the green dotted line showed hyperplasia (C). (D) Statistical comparison of quantitative parameters in different stages of carcinogenesis (center line of boxplot: median; x of boxplot: mean): sequential increase in IPCL density, radius, and tortuosity and increase in epithelial thickness from normal to premalignant change to cancerous change (p < 0.05) (MP: maximal projection; STD: standard deviation; EP: epithelial layer).

