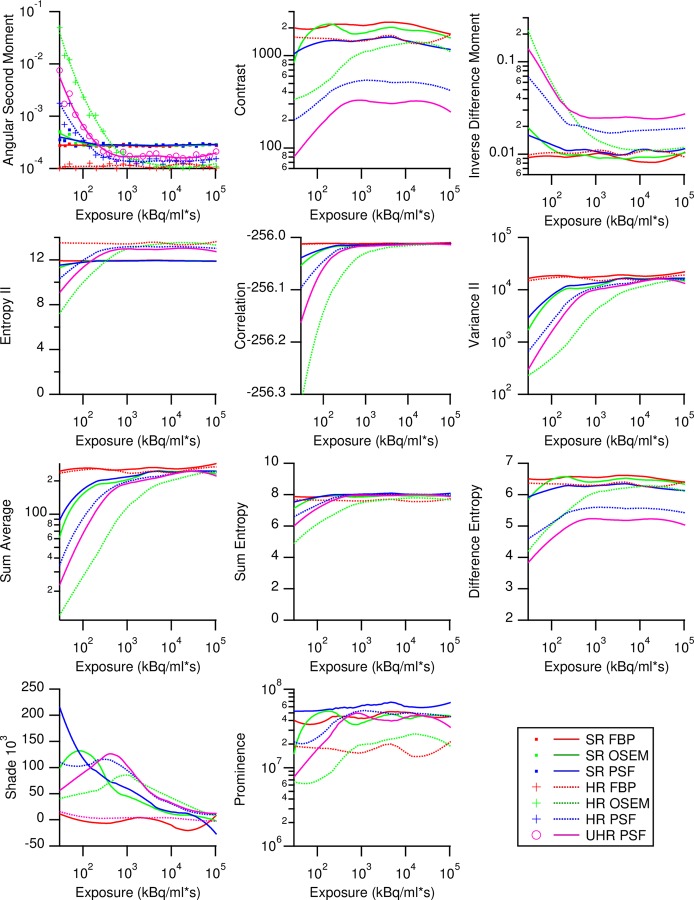
Fig 5. Exposure dependency of Haralick texture features according to different image resolution and reconstruction algorithm calculated from 8-bit GLCMs with 256 grey levels.
Measurement points are shown in the first graph but omitted in the following ones for clarity, and only the interpolated Loess curves are shown. Loess confidence interval are not shown. In the ASM panel, a clinical relevant exposure range is shown in grey, taken from Krarup et al. [47]. Legend applies to all.

