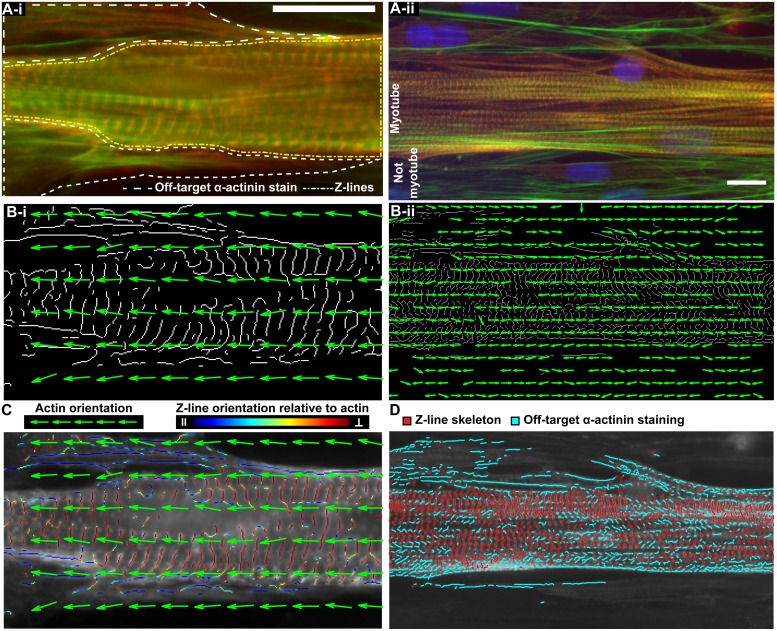
Fig 1. Actin orientation guided segmentation of the α-actinin skeleton.
A, Images of cardiac (Ai) and skeletal muscle (Aii) stained for actin fibrils (green), α-actinin (red), and nuclei (blue). In Ai, off-target α-actinin stain is outlined in white and the region containing z-lines is outlined with a yellow dashed-dotted line. B, The orientation of the actin fibrils in (A), represented by green arrows, plotted on top of the α-actinin skeleton. C, Actin orientation vectors (green) overlaid on α-actinin stained cardiac tissue (Ai) where each pixel in the α-actinin binary skeleton (Bi) is colored according to its orientation relative to local actin orientation from parallel (dark blue) to perpendicular (red) as indicated by the colorbar. D, Skeletal muscle shown in Aii with off-target α-actinin staining (blue) and z-lines (red). Scale bars: 15 μm.

