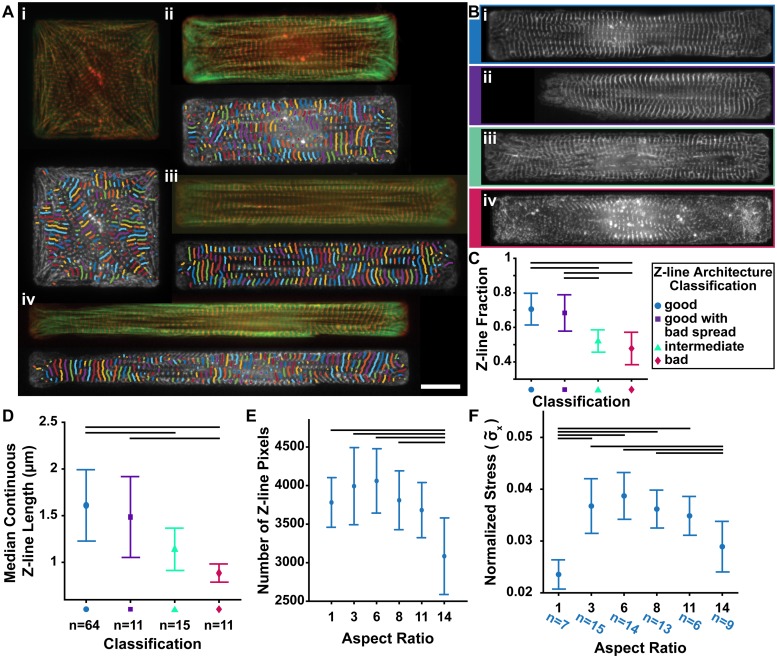
Fig 3. Analysis of cardiomyocytes with variable aspect ratios.
A, (top) Images of single cells with area 2500 μm2, but variable aspect ratios ((Ai) 1:1, (Aii) 3:1 (Aiii) 6:1 (Aiv) 11:1) stained for actin (green) and α-actinin (red) and their corresponding continuous z-lines (bottom). B, Representative α-actinin stained cardiomyocytes (extracellular matrix (ECM) island ~6:1 aspect ratio) for each z-line architecture classification: (Bi) good z-line architecture, (Bii) good z-line architecture with bad spread in ECM island, (Biii) intermediate z-line architecture, and (Biv) immature, underdeveloped (bad) z-line architecture. C, Average z-line fraction for cells. D, Average median continuous z-line length for cells (n = 101) within each classification of z-line architecture as described in C. E, Mean and standard deviation of the number of z-line pixels for the good cells of each aspect ratio. F, Mean and standard deviation of the estimated force for the good cells of each aspect ratio. Groups were compared using ANOVA with Tukey’s test p <0.05 (black bars in C, E, and F). Scale bar: 15 μm.

