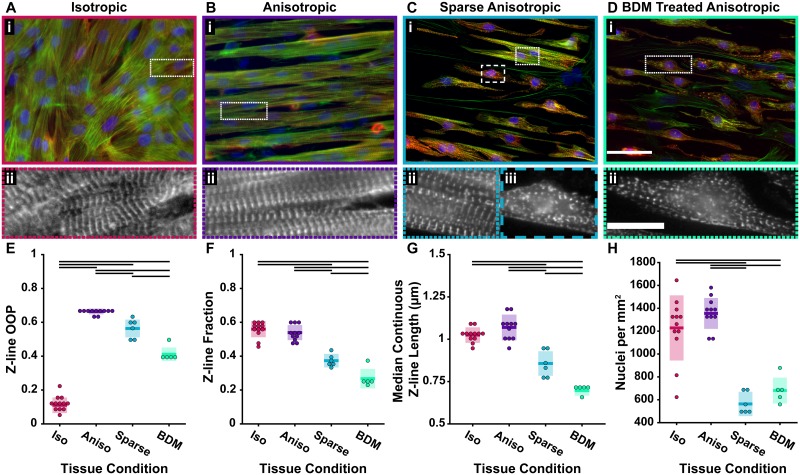
Fig 4. Comparison of cardiac tissues.
A-D, Cardiac tissue stained for actin (green), α-actinin (red), and nuclei (blue) on a uniform layer of FN (A), FN in lines (B), FN in lines with sparsely seeded cardiomyocytes (C), and FN in lines with cardiomyocytes treated with BDM (D). E, Z-line OOP. F, Z-line fractions. G, Median continuous z-line lengths. H, Nuclei per area. In E-H Each dot represents a coverslip. In E-H, each dot represents a single coverslip, colored bars represent the mean, and colored boxes represent the standard deviation. Groups were compared using ANOVA with Tukey’s test p <0.05 (black bars in E, F, G and H). Number of coverslips (cs) for each condition: isotropic cs = 12, anisotropic cs = 11, sparse anisotropic cs = 6, BDM treated cs = 5. Scale bars: (A-Di) 50 μm; (A-D ii) 15 μm.

