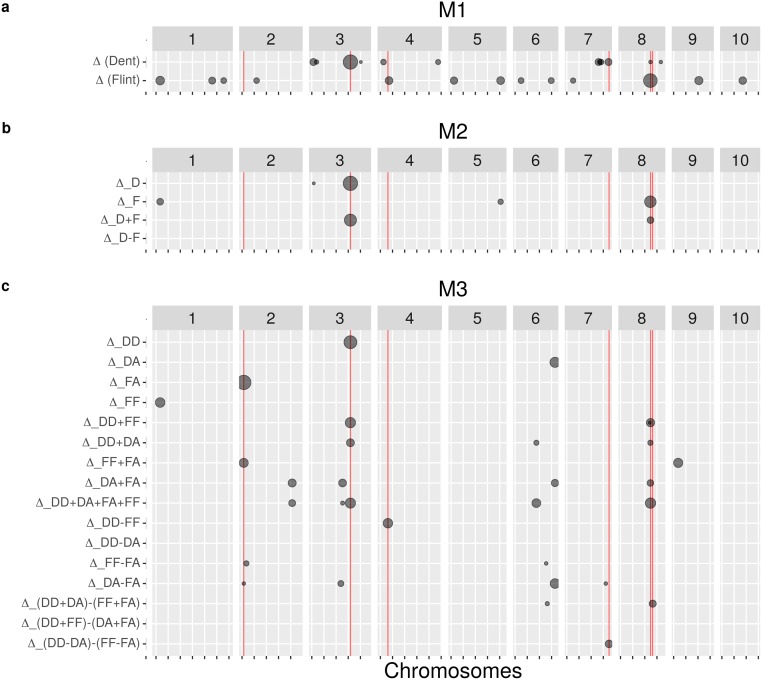
Fig 4. Position of QTLs detected with (a) M1, (b) M2 and (c) M3 for MF using a FDR of 20%.
The size of the grey dots is proportional to the -log10(pval) of the test at the most significant SNP of the region. Red vertical lines correspond to the location of the QTLs presented in section “Highlighted QTLs”. Note that major QTLs detected by a model may be discarded with another model because of filtering on allele frequencies.

