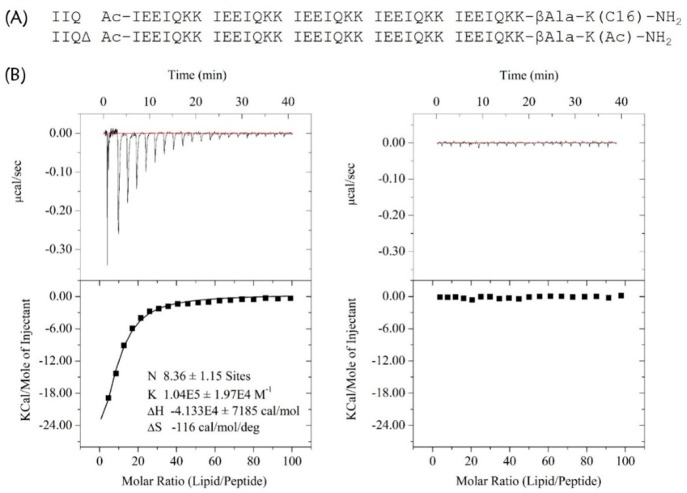
Figure 4.
Analysis of the binding of IIQ to a lipid bilayer. (A) The sequences IIQ and the negative control IIQΔ. (B) POPC LUVs (10 mg/mL) were injected into a chamber containing 15 μM IIQ (left) or IIQΔ (right) at 25 °C. Data acquisition and analysis were performed using MicroCal Origin software (version 7.0). The upper panels show the titration traces, and the lower panels show the binding affinity when POPC LUVs were injected into IIQ or IIQΔ solution.

