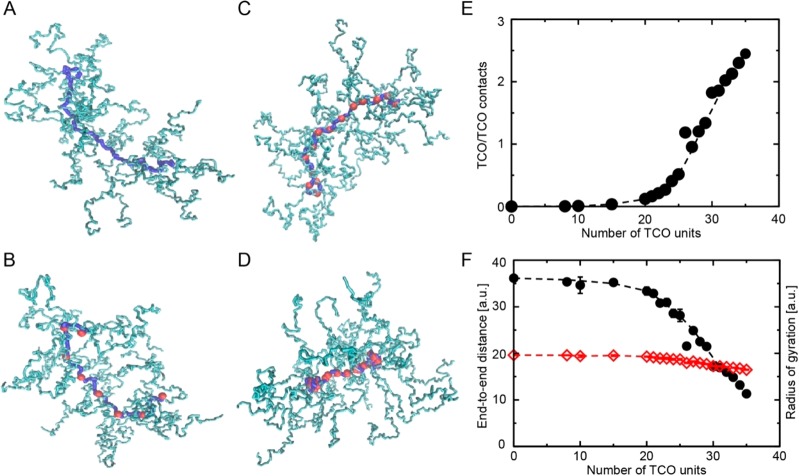
Figure 4.
Coarse-grained simulations of PeptoBrushes with different degrees of TCO loading. Red dots = TCO units/patches, blue line = pGlu backbone, turquoise side chains = pSar. (A–D) Simulation snapshots with 0, 8, 15, and 30 TCO units. (E) Average numbers of TCO/TCO contacts per TCO unit (see SI). (F) End-to-end distance of backbone chain (black) and radius of gyration of the whole brush (red) versus number of TCO units. Lines are a guide for the eye. The snapshots were produced using the VMD package.50

