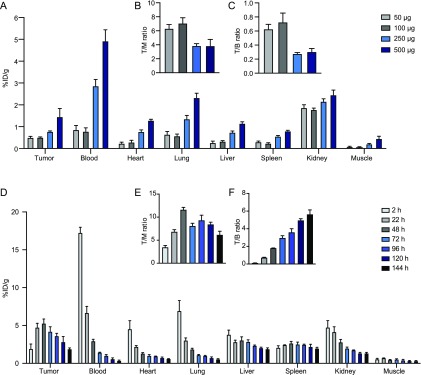
Figure 6.
(A) Ex vivo biodistribution showing tissue uptake (%ID/g), (B) tumor-to-muscle (T/M) ratio, and (C) tumor-to-blood (T/B) ratio, 2 h p.i. of [111In]20 in CT26 tumor-bearing mice injected with 50, 100, 250, or 500 μg of PeptoBrush 1 72 h earlier (n = 4). Data are shown as mean and standard error of mean (SEM) (D) Ex vivo biodistribution showing uptake values (%ID/g), (E) tumor-to-muscle (T/M) ratios, and (F) tumor-to-blood (T/B) ratios at different time points for CT26 tumor-bearing mice injected with 100 μg of [111In]21 (n = 3 for each time point). Data are shown as mean and standard error of mean (SEM).

