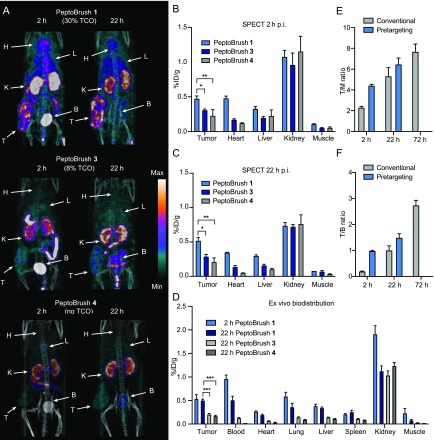
Figure 7.
Pretargeted imaging of PeptoBrush 1 (100 μg) and [111In]20. (A) Representative SPECT/CT images (maximum intensity projection) of pretargeted imaging 2 and 22 h p.i. PeptoBrush 1, PeptoBrush 3, or PeptoBrush 4 was injected 72 h prior to [111In]20, and SPECT/CT imaging was performed at 2 and 22 h p.i. Each image is scaled between its minimum and maximum pixel intensity; n = 3 in each group. Data represent mean ± SEM. Abbreviations: H = heart, L = liver, K = Kidney, B = bladder, and T = tumor. (B) Image derived mean uptake values (%ID/g) at 2 h and (C) at 22 h p.i. of [111In]20 (pretargeted imaging). PeptoBrush 1 was injected 72 h before [111In]20 administration. (D) Ex vivo biodistribution from mice injected with 100 μg of PeptoBrush 1, PeptoBrush 3, or PeptoBrush 4 72 h before [111In]20 administration. (E) Comparison of T/M ratios from conventional and pretargeted SPECT imaging. Images and data from conventional imaging with 100 μg [111In]21 in SI Figure S16. (F) Comparison of T/B ratios from conventional and pretargeted SPECT imaging. Images and data from conventional imaging with 100 μg [111In]21 in SI Figure S16. Tumor uptake in (B), (C), and (D) were compared using one-way ANOVA with Tukey’s posthoc test; *p < 0.05, **p < 0.01, and ***p < 0.001.

