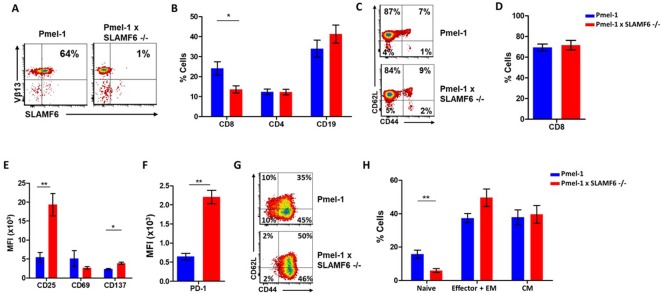
Figure 3. Establishment of Pmel-1 x SLAMF6 -/- mice as a source of SLAMF6-KO antigen-specific lymphocytes.
(A) SLAMF6 and Vβ13 expression in Pmel-1 or Pmel-1 x SLAMF6 -/- splenocytes measured by flow cytometry. (B) Percent CD8+, CD4, and CD19 cells in spleens from Pmel-1 or Pmel-1 x SLAMF6 -/- untreated mice. (C) Pmel-1, and Pmel-1 x SLAMF6 -/- CD8+ untreated splenocytes were stained with anti-CD44 and anti-CD62L. One representative experiment is shown. (D) Percent CD8+ cells in Pmel-1 or Pmel-1 x SLAMF6 -/- splenocytes after 7 days of in vitro activation with gp10025-33 peptide and IL-2 (30 IU/ml). (E) Flow cytometry for activation markers (CD25, CD69, CD137) in Pmel-1 or Pmel-1 x SLAMF6 -/- splenocytes after 3 days of in vitro activation, as in (D). Median fluorescence intensity (MFI) is shown. (F) Expression of PD-1 in Pmel-1 or Pmel-1 x SLAMF6 -/- CD8+ T cells after 7 days of in vitro activation, as in (D). Median fluorescence intensity (MFI) is shown. (G, H) After 7 days of activation, Pmel-1 and Pmel-1 x SLAMF6 -/- CD8+ T cells were stained with anti-CD44 and anti-CD62L. CD8+ subpopulations were defined for each mouse strain. (G) One representative experiment and (H) summary of subpopulations identified by flow cytometry in five experiments is shown. EM, effector memory, CM, central memory. Student t-test. *, p<0.05, **, p<0.01, ***, p<0.001.


