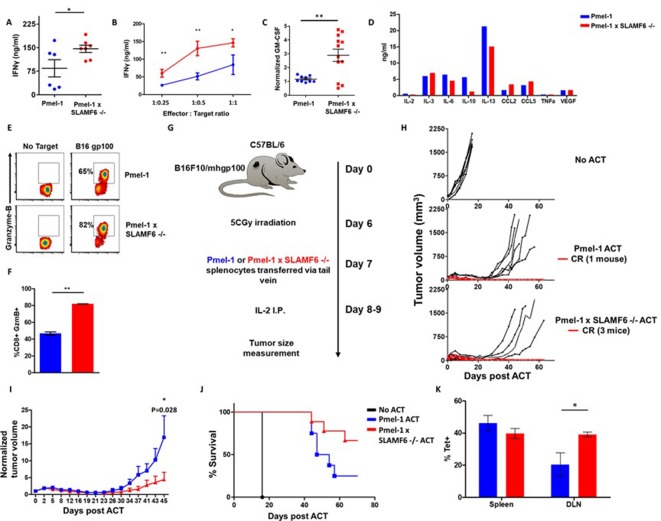
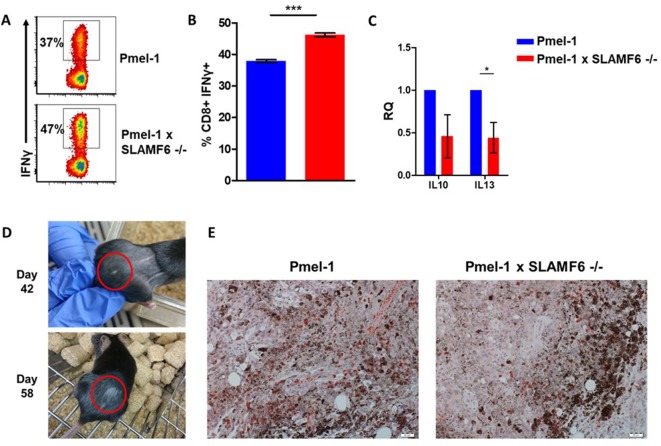
Figure 4. Pmel-1 x SLAMF6 -/- T cells have a better functional capacity.
(A–D) Pmel-1 or Pmel-1 x SLAMF6 -/- splenocytes were activated for 7 days with gp10025-33 peptide and IL-2 (30 IU/ml) and then incubated overnight with B16-F10/mhgp100 melanoma cells. (A) The cells were incubated at a 1:1 effector-to-target ratio. IFN-γ secretion was measured by ELISA. Each point represents one mouse. (B) The cells were incubated at the indicated effector-to-target ratios. IFN-γ secretion was measured by ELISA. (C) The cells were incubated at a 1:1 effector-to-target ratio. GM-CSF secretion was measured by ELISA. Each point represents one mouse. (D) Conditioned medium was collected and analyzed with Quantibody mouse cytokine array. (E, F) Pmel-1 or Pmel-1 x SLAMF6 -/- splenocytes were activated for 7 days with gp10025-33 peptide and IL-2 (30 IU/ml) and then incubated for 16 hr with B16-F10/mhgp100 melanoma cells. Granzyme-B expression was detected by flow cytometry. One representative experiment (E) and a summary of triplicates (F) are shown. (G–J) B16-F10/mhgp100 mouse melanoma cells were injected s.c. into the back of C57BL/6 mice. Pmel-1 or Pmel-1 x SLAMF6 -/- mouse splenocytes were expanded with gp10025-33 peptide in the presence of IL-2 (30 IU/ml). On day 7, Pmel-1 cells or Pmel-1 x SLAMF6 -/- cells were adoptively transferred i.v. into the irradiated tumor-bearing mice. N = 8 mice per group. Tumor size was measured three times a week. (G) Scheme of the experimental layout. (H) Spider plots showing tumor volume [calculated as L (length) x W (width)2 x 0.5]. CR, complete response. (I) Normalized tumor volume (Mean ± SEM) until day 45, on which the first mouse had to be sacrificed. Tumor dimensions were normalized to the 1st measurement. (J) Kaplan Meier survival curve. (K) Percent T cells specific for gp10025-33 peptide in the spleen or tumor draining lymph nodes (DLN) of mice sacrificed 7 days post-ACT. Tet, tetramer. Student t test. *, p<0.05, **, p<0.01, ***, p<0.001.


