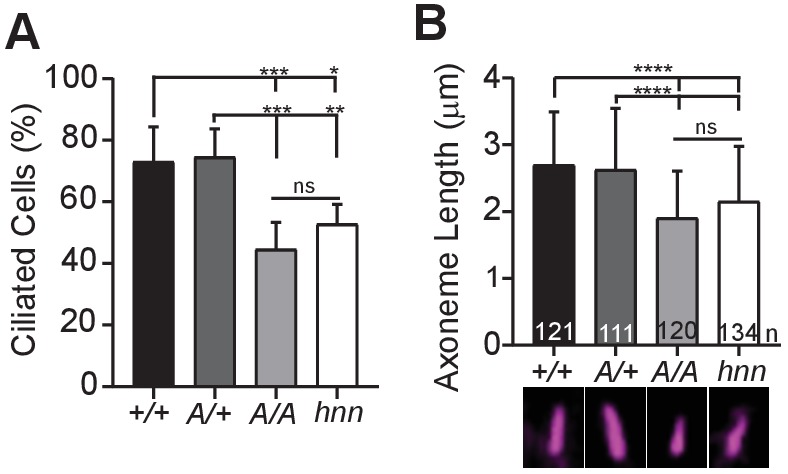
Figure 6. ARL13BV358A results in decreased ciliation rates and short cilia.

(A) Quantification of ciliation rates in all cell types; Arl13b+/+ (+/+), Arl13bV358A/+ (A/+), Arl13bV358A/V358A (A/A) and Arl13bhnn/hnn (hnn). Fewer Arl13bV358A/V358A and Arl13bhnn/hnn MEFs form cilia compared to Arl13b+/+ or Arl13bV358A/+ cells. (B) Quantification of axoneme length as labeled by acetylated α-tubulin (magenta) in indicated MEFs. Data are presented as mean (μm)± standard deviation with the number of cilia measured per genotype depicted at the base of each bar. Data analyzed by one-way ANOVA and Tukey’s multiple comparisons. (*p<0.05, **p<0.01, ***p<0.001, ****p<0.0001).
