
Figure 1.
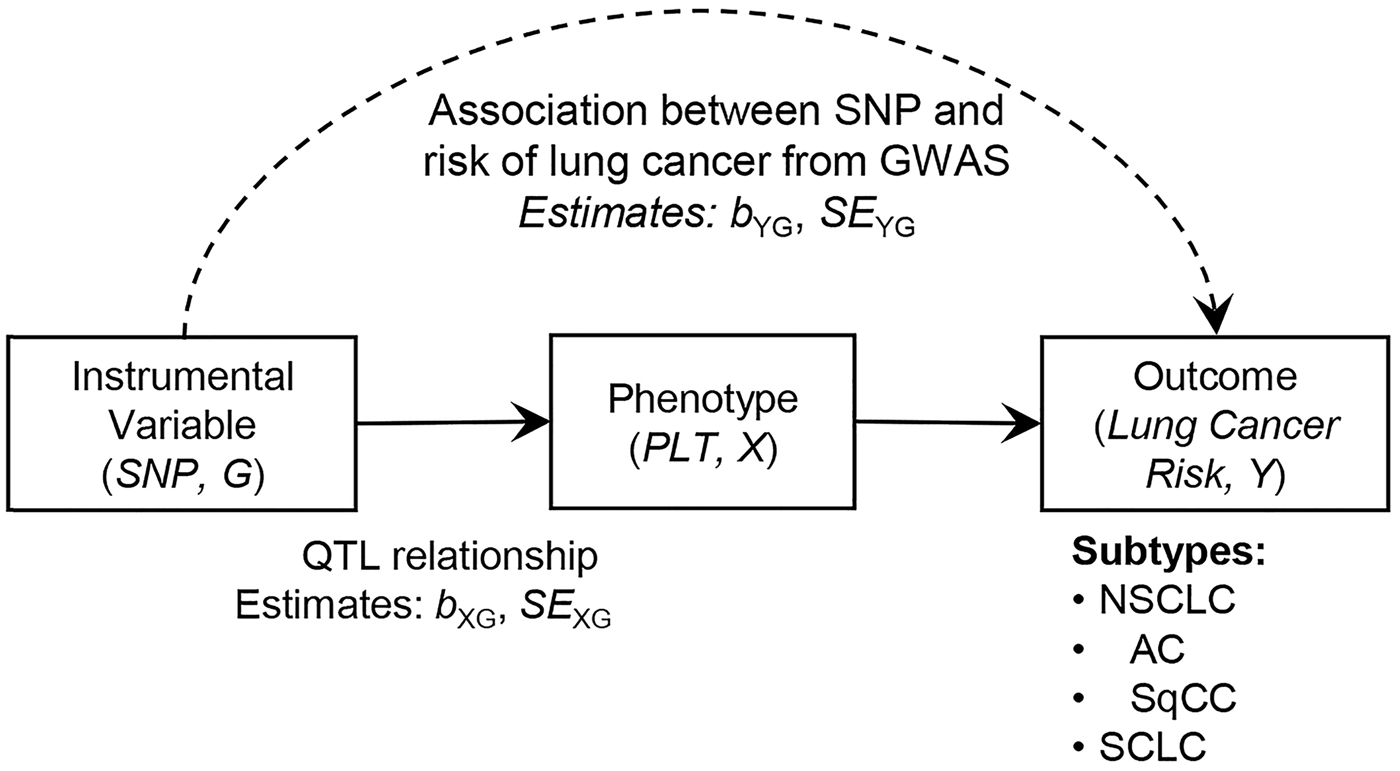
Diagram of Mendelian randomization (MR) analysis. MR aims to estimate the unbiased causal relationship between PLT and lung cancer risk by incorporating genetic variants as instrumental variables (IVs). Dashed line represents the association between instrumental variable (SNP) and outcome (risk of lung cancer), denoted using bYG in log(odds ratio) scale and its standard error (SEYG), which were obtained from GWAS. Estimates of quantitative trait loci relationship between SNP and phenotype (platelet count) were obtained from a recently published article, which were described by bXG and SEXG. Lung cancer risk was assessed for non-small cell lung cancer (NSCLC), adenocarcinoma (AC), squamous cell carcinoma (SqCC), and small cell carcinoma (SCLC).