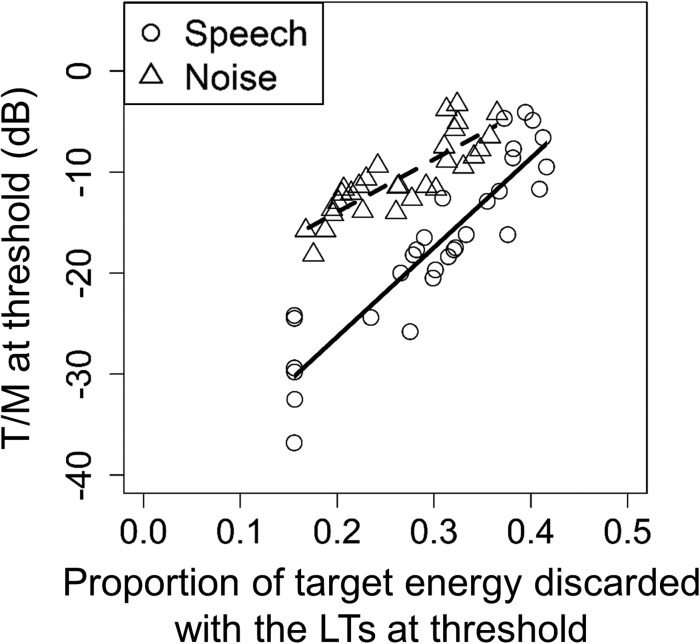
FIG. 4.
Behavioral T/Ms at threshold for each observer in each condition (other than the reference condition; cf. Table I) plotted against the proportion of target energy that was discarded with the LTs at threshold in the corresponding condition. Speech masker conditions are shown as circles and noise masker conditions are shown as triangles. The proportion of target energy discarded values was obtained on a per-observer basis using the functions shown in the bottom row of Fig. 3. Lines are linear least-squares fits to the data for speech maskers (solid line) and noise maskers (dashed line).

