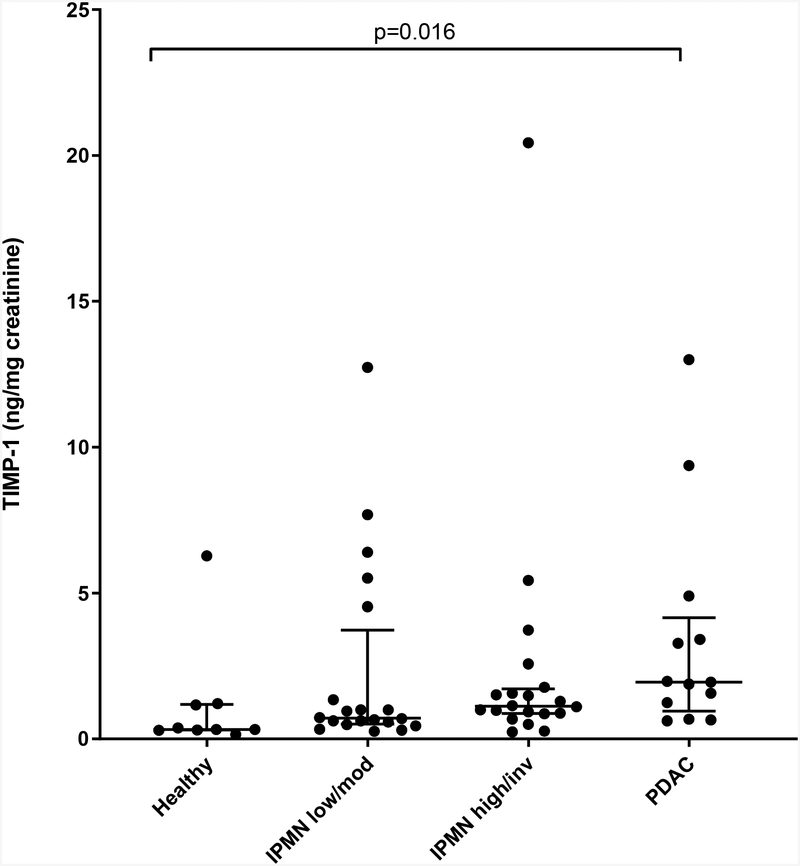
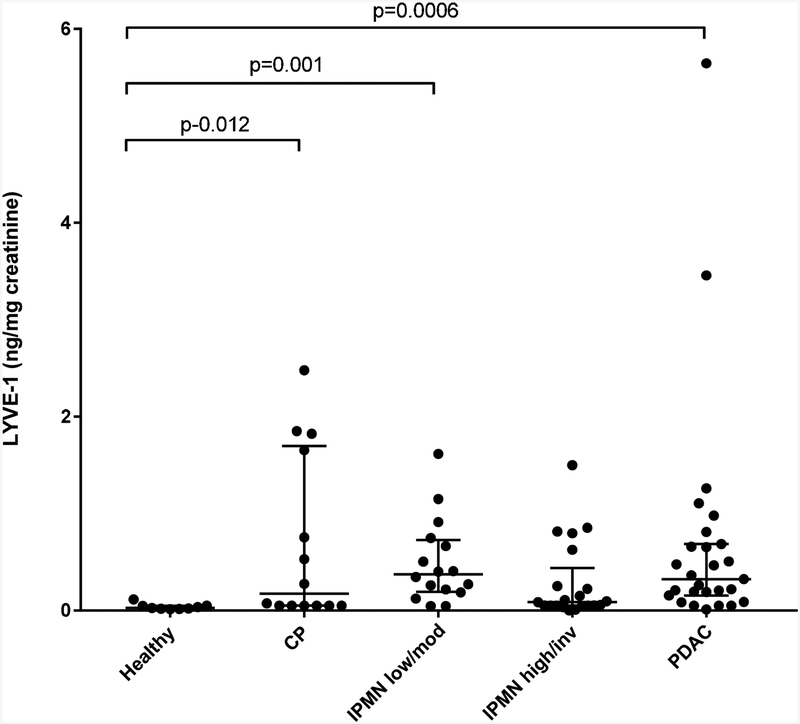
Figure 1. Urinary TIMP-1 and LYVE-1.
A) Normalized urinary TIMP-1 levels in healthy, low/moderate-grade IPMN, high-grade/invasive IPMN and PDAC are shown in the scatter plot (horizontal lines - median, interquartile range). B) Normalized urinary LYVE-1 levels in healthy, chronic pancreatitis (CP), low/moderate-grade IPMN, high-grade/invasive IPMN and PDAC groups are shown in the scatter plot. Statistically significant differences between groups are indicated; no significant differences were detected between low/moderate and high/invasive grades of IPMN.


