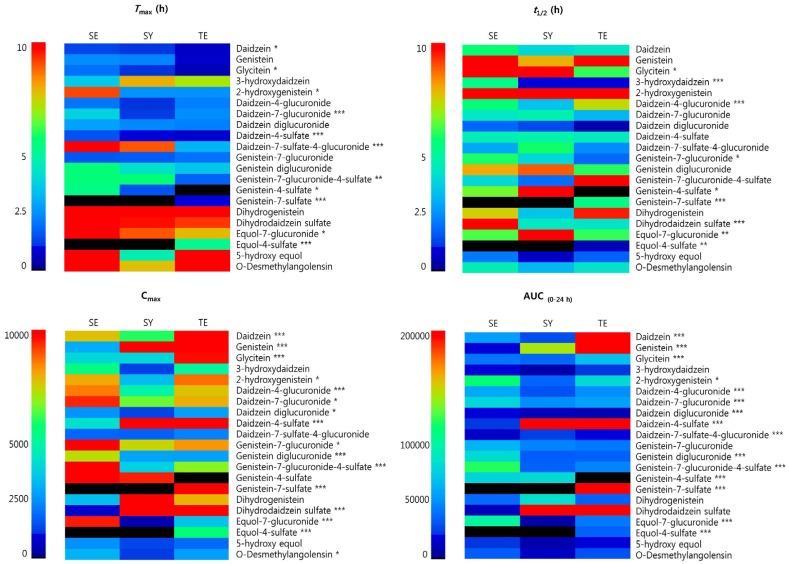
Fig. 1. Overview of Tmax (h), t1/2 (h), Cmax, and AUC(0-24 h) for 21 isoflavone metabolites detected in the plasma following ingestion of Cheonggukjang according to sasang typology.
Error bars represent the mean ± SEM (* P < 0.05; ** P < 0.01; *** P < 0.001). SE, Soeumin; SY, Soyangin; TE, Taeeumin; AUC(0-24 h): area under the curve of the metabolite peak area versus time; Tmax, time to maximum concentration; t1/2, elimination half-life; Cmax, maximum peak area.

