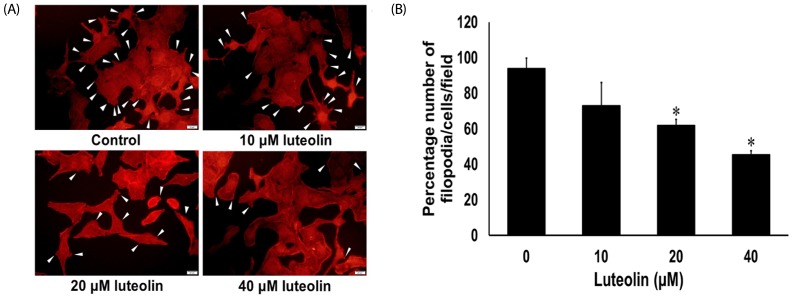
Fig. 5. Effects of luteolin on filopodia formation.
(A) A549 cells were stained with phalloidin-rhodamine (scale bar = 50 µm). White arrowheads indicate the filopodia. (B) Filopodia counts per cell after treatment with various concentrations of luteolin. Data are expressed as mean ± SEM from four independent experiments. The differences between groups were evaluated by one-way ANOVA. *P < 0.001 compared to control.

