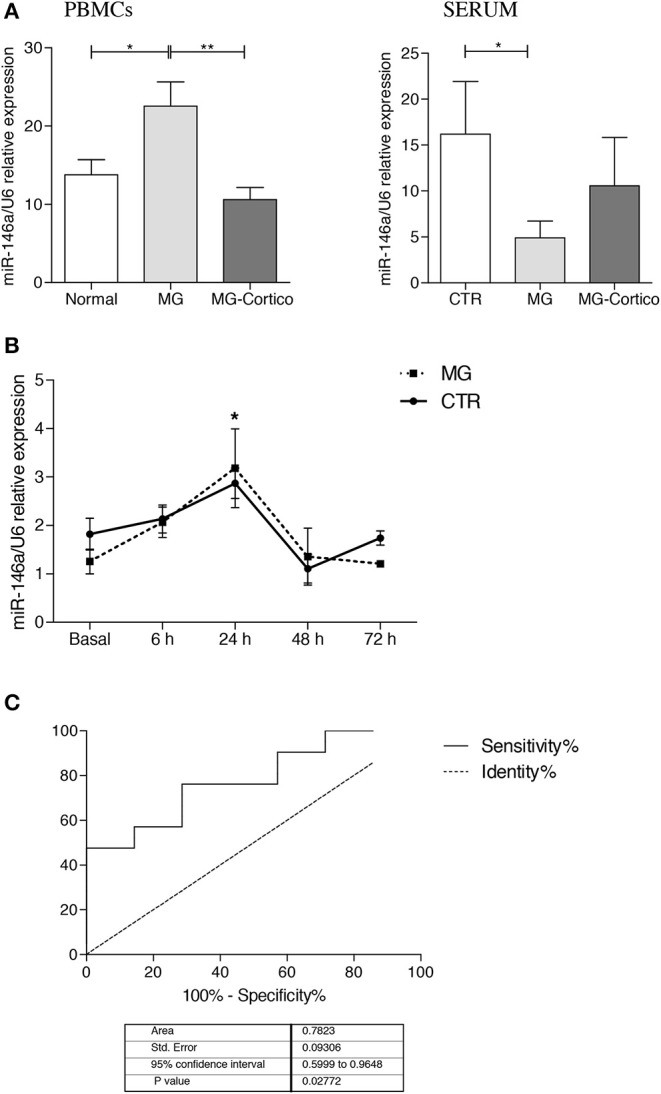
Figure 5.

Peripheral expression of miR-146a in myasthenia gravis (MG). (A) Real-time PCR analysis of miR-146a expression in peripheral blood mononuclear cells (PBMCs) (left graph) and serum (right graph) from MG patients (n = 31, 13 of whom were corticosteroid-treated, MG-Cortico) and healthy controls (n = 11). miR-146a levels were expressed as relative values (2−ΔCt × 100) normalized toward the endogenous small nuclear RNA (snRNA) U6. p values were assessed by Kruskal–Wallis test followed by the Dunn's post hoc test. *p < 0.05; **p < 0.01. (B) In vitro assay of miR-146a expression in PBMCs from four MG patients and three healthy controls, treated with prednisone at 6, 24, 48, and 72 h. miR-146a levels were analyzed by real-time PCR and expressed as relative values (2−ΔCt × 100) normalized toward U6 snRNA. In the graph, the mean relative expression levels ± SEM of miR-146a estimated in cells from the four MG patients and from the three controls at basal condition and after 6, 24, 48, and 72 h of treatment with prednisone are shown. p values were assessed by Kruskal–Wallis test followed by the Dunn's post hoc test. *p < 0.05 (24 h of treatment vs. basal condition). (C) Receiver operating characteristic (ROC) curves used to assess the sensitivity and specificity of miR-146a in serum as biomarker for MG.
