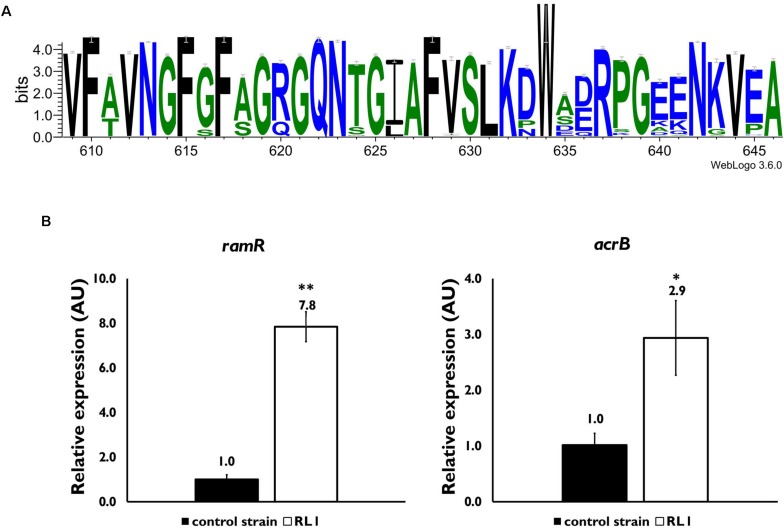
FIGURE 1.
Characterization of the effect of mutations in acrB and ramR. (A) A consensus sequence logo of the switch loop was generated through https://weblogo.berkeley.edu/ using the multiple sequence alignment tool CLUSTAL 2.1. Sequences of 998 Gram-negative bacterial species and strains were used. (B) Quantitative reverse transcriptase-polymerase chain reaction (PCR) analysis of the relative expression of the ramR (left panel) and acrB (right panel) mRNA levels, in mid-log phase bacteria. The values are average of three biological replicates, each performed in triplicates. Statistical analysis was done using t-test. ∗P < 0.05, ∗∗P < 0.01.

