FIGURE 2.
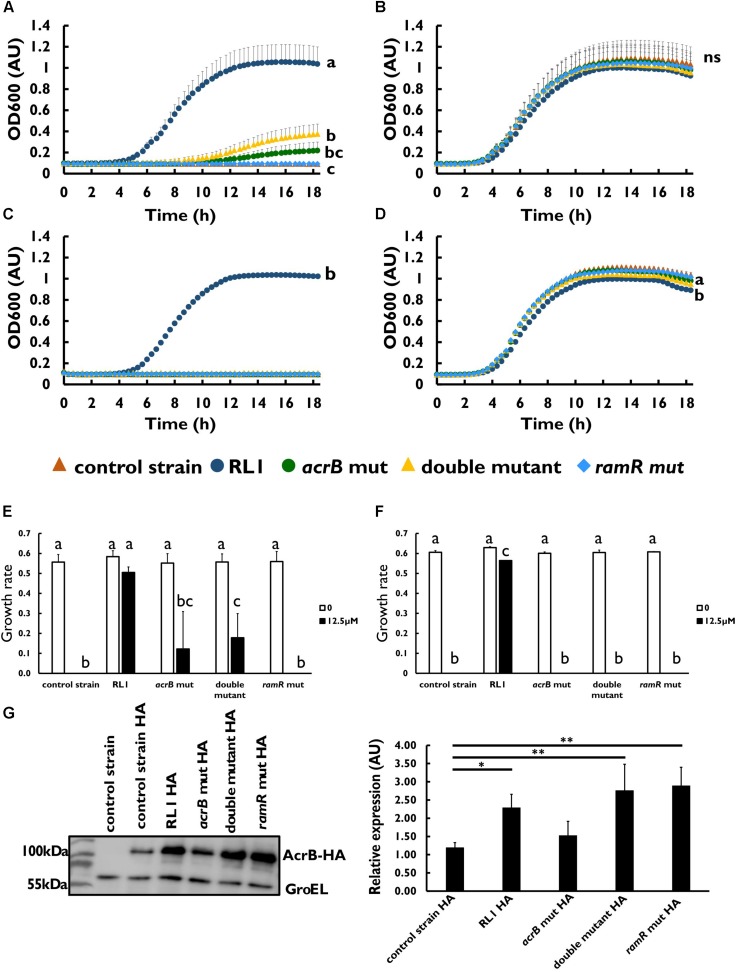
The effect of mutations in acrB and ramR on resistance and on AcrB protein levels. Growth curve of bacterial strains at 12.5 μM of (A) 4DK5L7 peptide and (B) without peptide. Growth curve of bacterial strains at (C) 12.5 μM seg5D peptide or (D) without peptide. Growth rates of the strains at the different peptide concentrations of (E) 4DK5L7 and (F) seg5D. OD600 was monitored every 20 min for 18 h. Statistical analysis was performed using Tukey multiple comparison test for all the time points. Statistically significant differences are indicated as a≠b≠c, P < 0.05. The values are average of at least three biological replicates, each performed in duplicates. Error bars indicate the standard error. (G) Left panel: acrB-HA protein levels in mid log phase bacteria were measured by western blot. The control strain bacteria without the HA epitope tag was used as a negative control. Anti-GroEL antibody was used for loading control. Right panel: quantification of the AcrB-HA relative expression, an average of three biological replicates. Statistical analysis was performed using Dunette multiple comparison analysis. ∗P < 0.05, ∗∗P < 0.01.

