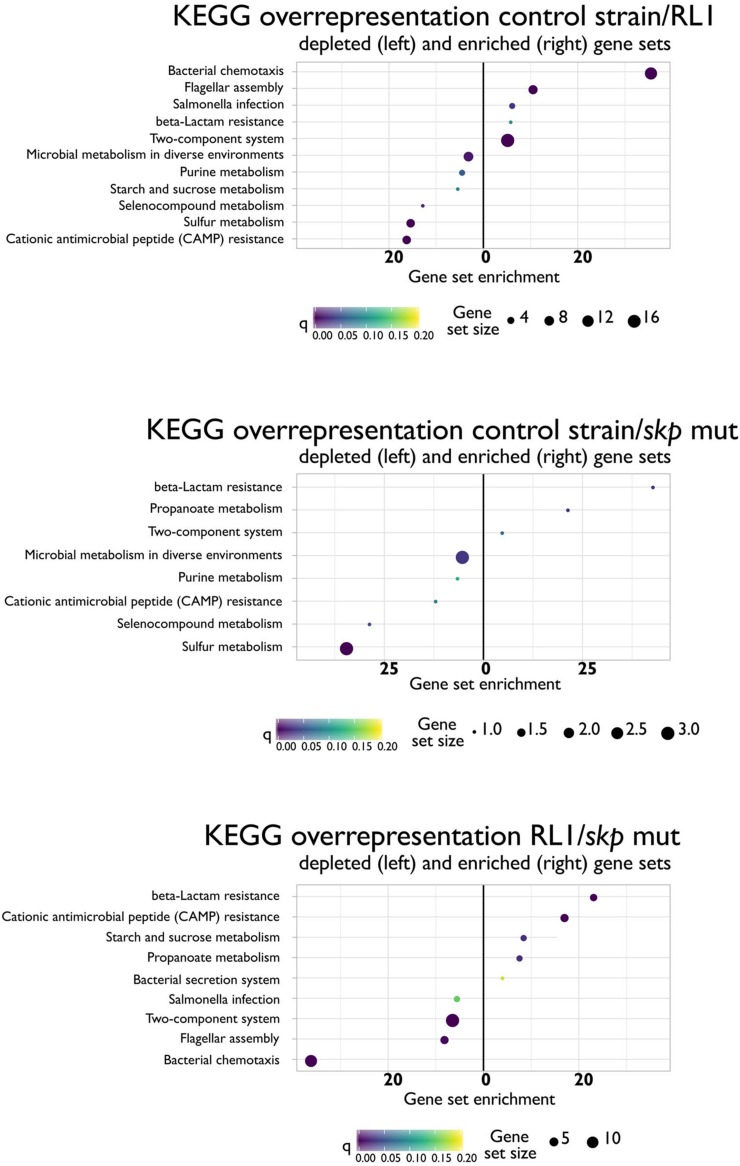
FIGURE 7.
Differences in KEGG cellular pathways between the control strain, RL1, and the skp mut. Depletion (left) or enrichment in cellular pathways in the ratio of control strain/RL1 (upper), control strain/skp mut (middle), or RL1/skp mut (lower). The analysis was performed for mid-log phase bacteria based on three independent replicates for each strain.

