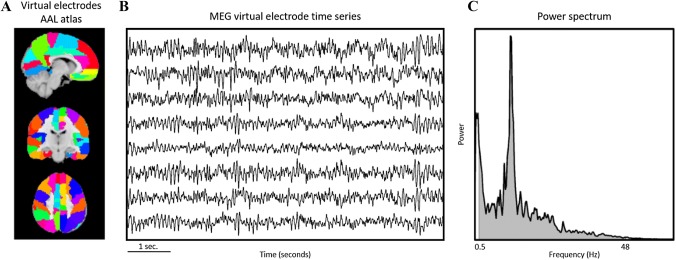
Fig. 1.
Broadband power calculated from magnetoencephalography time series: a Time series were estimated, using beamforming, for virtual electrodes placed at the centroids of regions in the automated anatomical labeling (AAL) atlas. b Exemplar broadband time series. c The power spectrum for each time series was obtained using a fast Fourier transform, and then averaged. Broadband power was calculated as the area under the curve between 0.5 and 48 Hz (grey surface)

