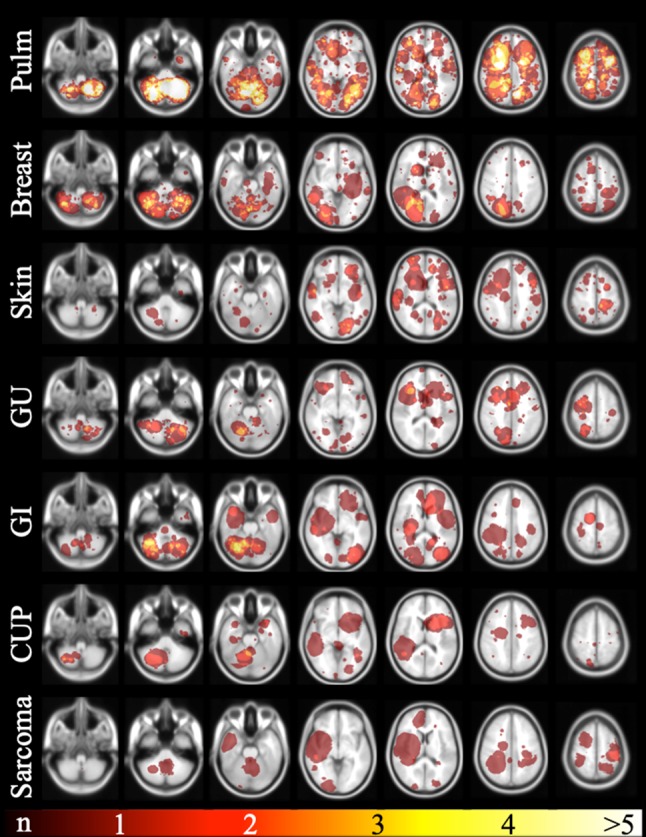
Fig. 2.

Brain probability maps of the different primary tumors. The selected brain slices from caudal (left) to cranial (right) are identical to Fig. 1. Each row represents another primary tumor group. The top row depicts brain metastases distribution of the pulmonary cancer patients representing the largest primary tumor group. The red-yellow colored scale on the very bottom indicates the number of BM per area (with red representing one metastasis and yellow the maximum number of metastases per area). The primary tumor group “head and neck “ is not shown. Pulm pulmonary primary tumor, GU genitourinary primary tumor, GI gastrointestinal primary tumor, CUP cancer of unknown primary
