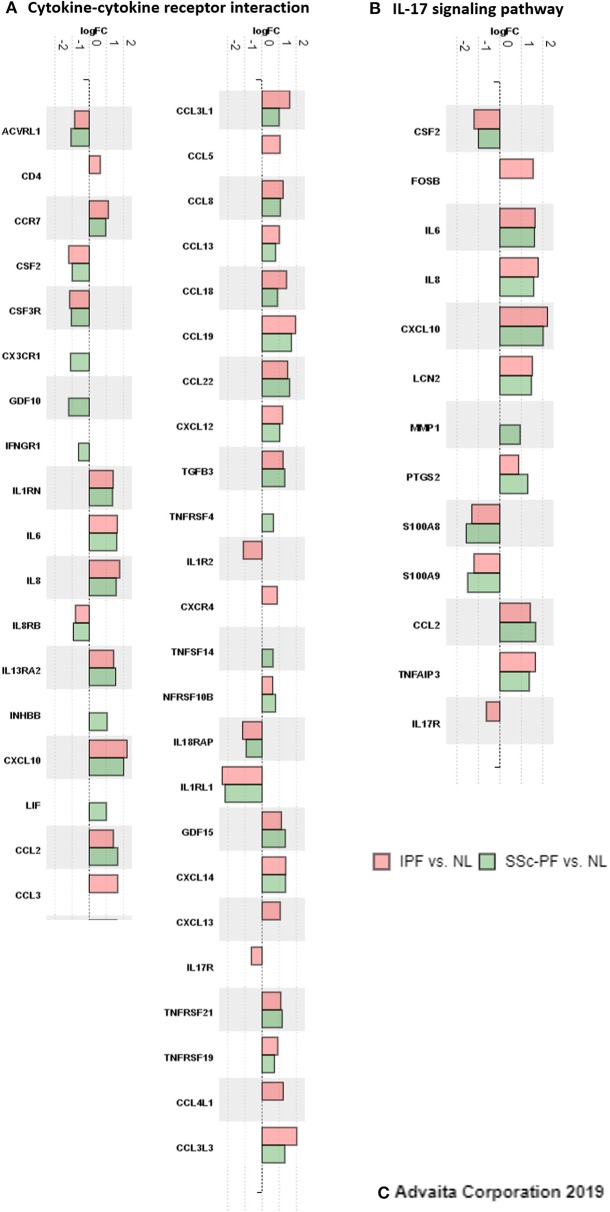
Figure 8.
Inflammatory response signatures in IPF and SSc-PF. DE genes (q < 0.1, log2FC > |0.6|, linear FC of 1.5) that are hit genes in the “cytokine-cytokine receptor interaction” and “IL-17 signaling” pathways are shown here, color-coded by DE analysis. Peach: IPF vs. NL, and green: SSc-PF vs. NL.

