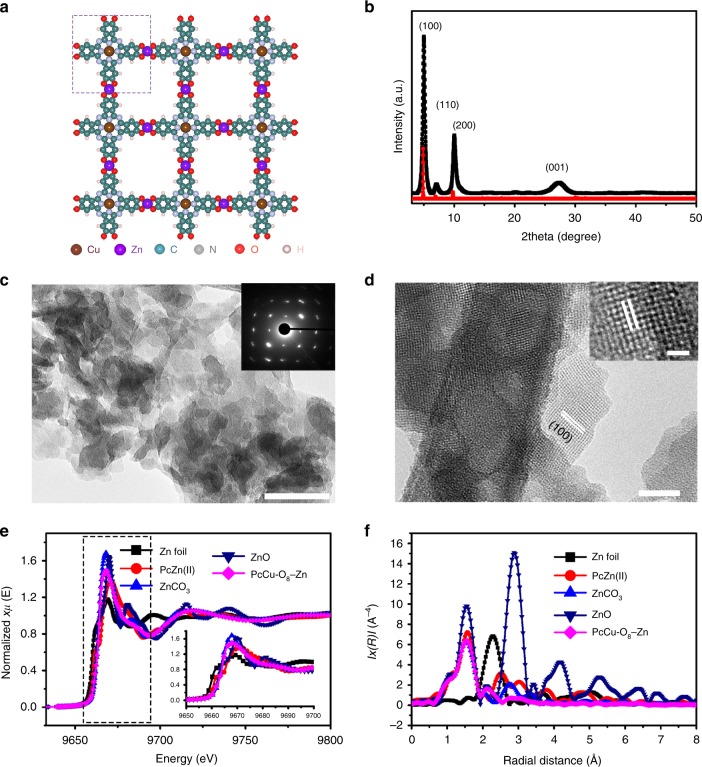
Fig. 2. Structure and morphology of PcCu-O8-Zn.
a Schematic structure of PcCu-O8-Zn (the dashed rectangular indicates the unit cell). b Experimental (black square dot line) and calculated (red circle dot line) XRD patterns of PcCu-O8-Zn. c TEM image of PcCu-O8-Zn sample (inset: selected area electron diffraction pattern), Scale bar: 60 nm. d HR-TEM image of PcCu-O8-Zn sample. Scale bar: 20 nm (inset: 5 nm). e Zn K-edge XANES spectra for Zn foil, ZnO, ZnCO3, PcZn(II) and PcCu-O8-Zn. Inset: the enlarged figure of the XANES spectra between 9650 and 9700 eV. f Fourier transform EXAFS of Zn foil, ZnO, ZnCO3, PcZn and PcCu-O8-Zn.

