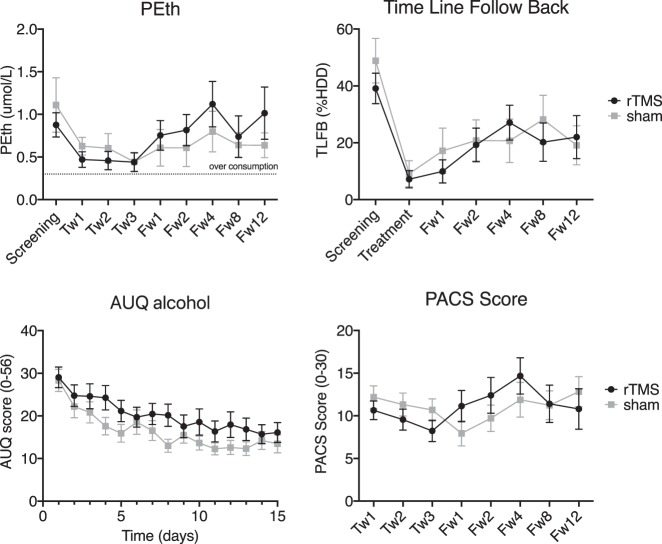
Fig. 2.
Average consumption and craving scores measured in rTMS and sham groups at screening, treatment and follow-up visits. Upper level: Consumption as measured by PEth and TLFB. For PEth, two separate ANOVAs were performed. In the first 2 × 4 ANOVA, the “time” factor included four levels, corresponding to screening and treatment weeks 1, 2, and 3. In the second ANOVA, the “time” factor included six levels (screening and all follow-up visits). For TLFB a 2 × 2 ANOVA was performed using scores collected at screening and end of treatment. In addition, a 2 × 6 ANOVA was performed on screening and all follow-up visits. A significant effect of time during treatment period was observed in both measures, independently of group. Lower level: craving scores by AUQ and PACS. For AUQ scores, a 2 × 15 ANOVA was performed, the factor “time” included each day when AUQ was collected. PACS scores were entered in a 2 × 3 ANOVA, where the within-subject “time” factor included assessments at treatment weeks 1, 2, and 3. Error bars show standard error of the mean. There was a significant decrease in craving and drinking during treatment in all measures, independently of group. Tw[n] = week n of treatment; Fw[n] = follow-up week n. Upper right: Treatment = the part of TLFB from the first follow-up visit covering the weeks of rTMS treatment. %HDD, percent heavy drinking days

