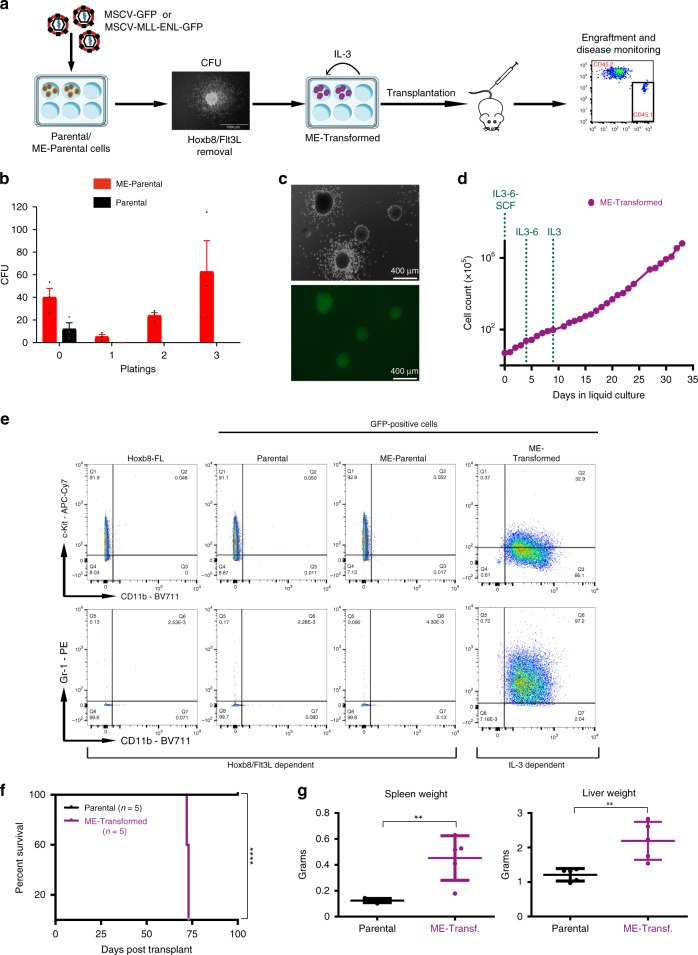
Fig. 1. Development of a clonally derived MLL-ENL mouse model.
a Schematic outline of in vitro and in vivo experimental scheme. Hoxb8-FL cells were transduced with MLL-ENL or empty virus to generate ME-Parental and Parental cells, respectively. When cultured in methylcellulose without Flt3L and estradiol (causing retention of Hoxb8-ER in the cytoplasm), only ME-Parental cells had re-plating capabilities. These cells were transferred to liquid culture supplemented with IL-3, IL-6 and SCF. Sequentially, SCF and IL-6 were removed to obtain ME-Transformed cells able to grow long term in the presence of IL-3. These cells were then tail injected into lethally irradiated mice, followed by close monitoring of engraftment and disease onset. b Bar graph showing colony numbers at each round of methylcellulose plating (every 7 days). Mean and SEM are represented. N = 3 biologically independent experiments. c Colonies generated in methylcellulose by MLL-ENL-transduced Hoxb8-FL cells are characterised by either a compact centre or a compact centre with a halo of differentiating cells (images taken using an EVOS® inverted fluorescence microscope). This experiment was repeated three times with similar results. d Growth curve of ME-Transformed cells following dissociation of methylcellulose colonies obtained after three replatings. Cells were kept in liquid culture supplemented with IL-3, IL-6 and SCF for two passages. SCF was removed from the culture for the following two passages, IL-6 was then also removed after two passages and then cells were cultured only with IL-3. e Phenotypic characterisation of untransduced (Hoxb8-FL) and transduced (Parental and ME-Parental) cells cultured in the presence of Flt3L and β-estradiol compared to ME-Transformed cells cultured in IL-3-only medium. ME-Transformed cells showed upregulation of myeloid markers CD11b and Gr-1 and downregulation of c-Kit, in contrast to Hoxb8-FL, Parental and ME-Parental cells. f Survival curve of mice transplanted with either Parental cells (n = 5) or ME-Transformed cells (n = 5) (two-sided log-rank Mantel-Cox test. ****p value = 0.0031). g Graphs showing difference in spleen (**p = 0.0028) and liver (**p = 0.0052) weight between ME-Transformed and Parental mice. Average of five mice per condition ± SEM, two-tailed unpaired t test. Source data are provided as a Source Data file.

