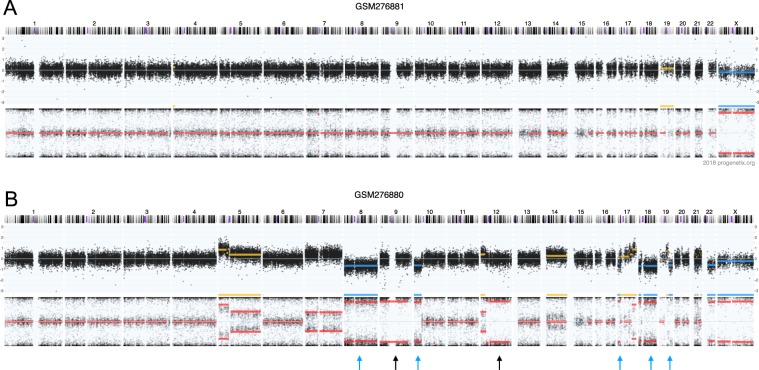
Figure 1.
CNV tracks for a paired normal/cancer samples deposited in GEO with sample IDs GSM276881 and GSM276880. GSM276880 is a glioblastoma sample. GSM276881 is its peripheral blood control. The CNV tracks are consisted of two panels. Upper panel indicates the total copy number, represented by logR ratio ( at any probe) Namely, logR = 0 indicates a position with normal two copies, logR > 0 indicates a copy number gain and logR < 0 indicates a copy number loss. Lower panel indicates the allele specific copy number, represented by B-allele frequency (BAF, ). Any given SNP position can have a value between 0 and 1. A line at 0.5 indicates a heterozygous region. Compared to the unaltered genome (A), the cancerous counterpart (lower) has copy number loss in chr8, 10p, 18, 19qter, 22q and copy-neutral loss of heterozygocity in chr9,12q, accounting for 18.2% of genome.

