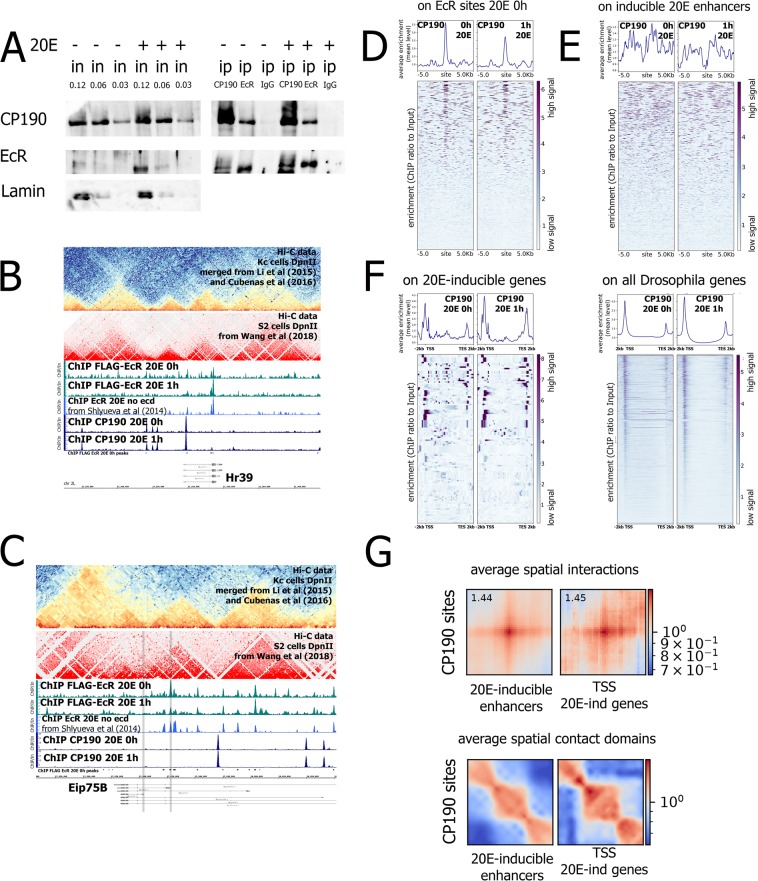
Figure 3.
CP190 co-immunoprecipitates with EcR and is present at 20E-dependent loci. (A) Immunoprecipitations from nuclear protein extracts of 20E- or DMSO-treated Drosophila S2 cells (1 hour treatment) were performed with specific antibodies against EcR and CP190 or a serum of non-immunized rabbits (ip IgG). Western blots were stained with corresponding antibodies indicated on the left of the figures. All IP samples were loaded on a single western blot and developed with the same exposure as input samples (only input samples for the EcR are provided with a greater exposure). Numbers above the inputs represent a portion of a loaded fraction (in respect to amount used for the immunoprecipitations). (B,C) Binding profiles of EcR and CP190 on 20E-inducible gene loci hr39 (B) and eip75b (C). Protein binding levels were estimated by ChIP-Seq. ChIP-Seq experiments obtained in the current study were performed using a 20E- or DMSO-treated Drosophila S2 cell line expressing 3xFLAG-EcR (1 hour treatment). For the ChIP-Seqs of EcR and CP190 anti-FLAG or specific anti-CP190 antibodies (ChIP FLAG-EcR or ChIP CP190, respectively) were used. For the comparison we also provide previously published data of ChIP-Seq experiments in Drosophila S2 cells with the specific anti-EcR generated by Shlyueva and colleagues (without 20E treatment - ChIP EcR no ecd)30. We also provide sub-kb resolution Hi-C data obtained for the Drosophila S2 cells by Wang and colleagues22. Protein binding levels in ChIP-Seqs are provided as an enrichment of ChIP-Seq signal over input DNA. Grey areas at the eip75b locus mark 20E-dependent promoters of this gene. (D,E) Average distribution of CP190 binding levels in 20E- or DMSO- treated Drosophila S2 cells (1 hour treatment) on EcR-bound sites (D) or 20E-inducible enhancers estimated previously by Shlyueva and colleagues by STARR-Seq30 (E). A list of EcR-bound sites was estimated with MACS2 peak caller using 3xFLAG-EcR ChIPseq data with the corresponding input obtained from DMSO-treated S2 cells (N = 591). Protein binding levels were estimated by ChIP-Seq using anti-CP190 antibodies. Heatmaps represent enrichment of ChIP-Seq signal over input DNA (presented as ratio of the number of reads at a given point). Pile-up profiles were calculated as a mean of binding levels of corresponding proteins in a given distance out from the binding site. (F) Average distribution of CP190 on genes in Drosophila S2 cells expressing FLAG-EcR after 1 hour treatment with 20E (1 h 20E) or in sham-treated cells (control S2). Average profiles were defined for genes whose transcription is induced in Drosophila S2 cells upon 20E treatment – S2 20E induced (defined in16). CP190 binding levels were estimated as an enrichment of CP190 ChIP-Seq signal over input DNA. Pile-up profiles were calculated as a mean of CP190 binding level. Average profiles were generated using metagene mode (introns were ignored). (G) Analysis of 3D interactions between the CP190 site and regulatory sites of 20E-dependent genes (enhancers and TSSs) using Hi-C data with a sub-kb resolution obtained previously from Drosophila S2 cells22. A list of CP190-bound sites was estimated with MACS2 peak caller using our ChIP-Seq data with the corresponding input obtained from DMSO-treated S2 cells. For this analysis enhancers induced by 20E (defined by STARR-Seq previously) and transcriptional start sites of genes induced upon 1 hour treatment of Drosophila S2 cells with 20E were used16,30. We estimated the average spatial interactions and average spatial contact domains between CP190 peaks and promoters/enhancers of 20E-dependent genes with a Coolpup.py program. Detailed information is provided in Methods.

