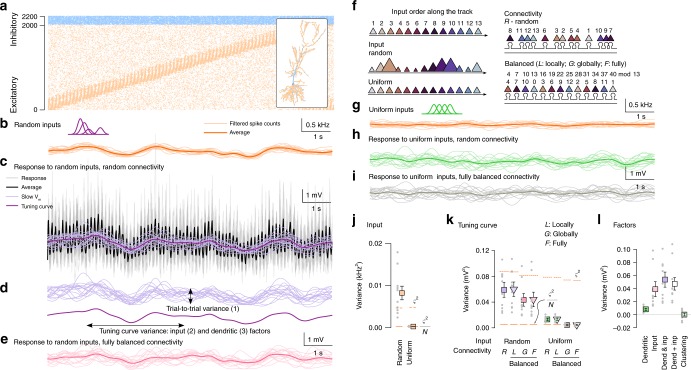
Fig. 2. Random synaptic clusters have small impact on neuronal tuning.
Source data are provided as a Source Data file. a Activity of the 2000 excitatory (orange, ordered by the place field location) and 200 inhibitory (blue) inputs in a single lap on the circular track. Inset: Morphology of the modelled CA1 pyramidal neuron and spatial distribution of excitatory and inhibitory synapses. b Filtered input spike counts in 16 individual trials (light) and average (dark) in the random input condition (purple: schematic place fields). c sVm response of the postsynaptic cell to inputs in 16 laps (grey), the average postsynaptic response (black), the low-pass filtered responses (slow Vm, light purple) and the tuning curve (dark purple) in the random input condition with random connectivity. d Decomposition of the response variance: trial-to-trial variability (top) and the tuning curve variance (bottom). e Slow Vm response in individual trials (light) and tuning curve (dark) in the random input condition with fully balanced connectivity. f Schematic for the inputs and connectivities. Top: ordering of 13 input place cells along the circular track. Colour difference is proportional to place field distance. Left: schematic of the random and uniform inputs. The size of the symbols correspond to the total input strength at a given location. Right: schematic of random (R) and balanced connectivity on a short segment of a single dendritic branch. To eliminate clustering, we used a co-prime ordering procedure either locally within branches (L), globally (G) or fully (F; see Methods; mod is the modulo operator). g Same as b in the uniform input condition. h, i Same as e with uniform inputs and random (h) or fully balanced (i) connectivity. j Variance of the average filtered input spike count in random and uniform input conditions. Solid line segments show the lower bound of the variance of the average of 16 laps based on trial-to-trial variability (ς2∕N) and dashed segments indicate trial-to-trial variance. k Tuning curve variance in the random and uniform input conditions with either random (R) or locally (L), globally (G) or fully balanced (F) connectivity. l Contribution of dendritic and input factors to response variance. Grey dots in j–l show N = 10 independent simulations with different synaptic configuration and inputs. Symbols and error bars show mean and SEM.

