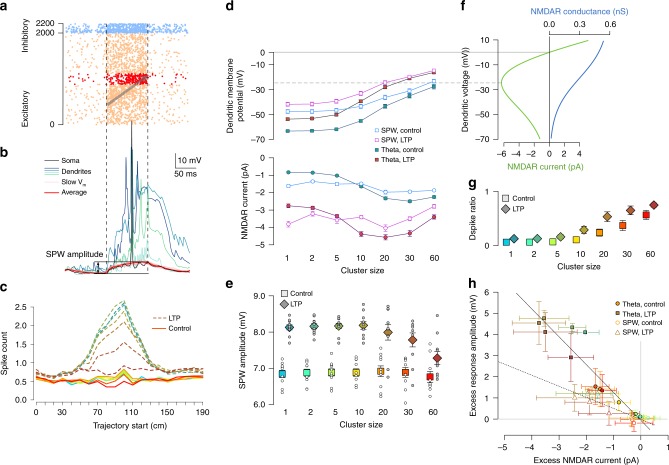
Fig. 4. Synaptic clustering have reduced impact during sharp waves.
Source data are provided as a Source Data file. a Simulated inhibitory (blue) and excitatory (orange and red) inputs during an example SPW (vertical dashed lines). Grey arrow indicates the replayed trajectory. Red dots show activity of the clustered synapses (Fig. 3b). b Somatic (black) and dendritic (colours) membrane potential response to SPW inputs in panel a (20 synapse per cluster); pink: slow Vm response in 16 trials; red: average sVm of the 16 trials, which was used to measure the amplitude of the depolarisation relative to the pre-SPW period. c Average number of somatic action potentials during individual SPW events as a function of the start location of the trajectory for control (solid lines) and LTP (dashed lines). Colour code: same as in panel e. The largest responses are when the trajectory starts at 90 and 100 cm, which are analysed further in panels d–h. d Local dendritic voltage at the synaptic clusters (top) and average NMDAR current of clustered synapses (bottom) during the maximal activity of the clustered inputs in SPW events (open symbols) and during theta state (filled symbols). Error bars indicate SEM across 40 dendritic branches (top) or 40 synapses (bottom). e Mean somatic depolarisation amplitude relative to the pre-SPW baseline (SPW amplitude, see panel b) as a function of cluster size for control (bright squares) and LTP (dark diamonds). Circles show 10 simulations with different cluster arrangements and inputs; symbols and error bars show mean and SEM. f NMDAR conductance (blue) and current (green) as a function of voltage. The peak NMDAR current is at ~−25 mV (dashed grey line), which was used as a dendritic spike threshold (panel g and Fig. 3g). g Mean and SEM of dendritic spike ratio during SPWs as the function of synaptic clustering across 10 simulations with 4 dendrites each. h Excess response amplitude in the soma (relative to the one synapse per cluster configuration) as a function of the average NMDAR current during theta (filled circles) and SPWs (open circles). Symbols show mean and SD across 10 cluster arrangements (vertical) or 40 synapses (horizontal). The high variability is explained by the large diversity between dendritic branches receiving clustered inputs.

