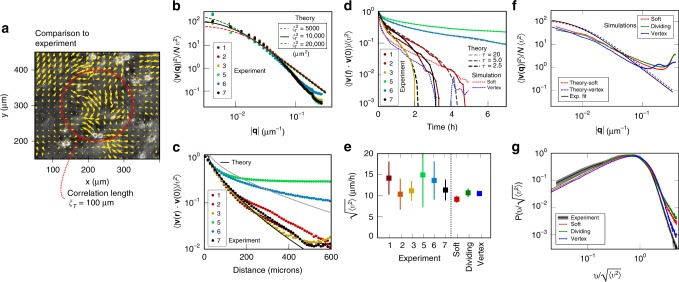
Fig. 4. Experimental results and comparison to theory and simulations.
a Cell sheet image overlaid with PIV arrows, and best fit length scale ξT. b Experimental Fourier velocity correlation function normalised by mean velocity (dots), and best fit to theory with a single stiffness parameter . c Experimental real-space velocity correlation function (dots) and theoretical prediction. d Velocity autocorrelation function for the experiments, theoretical predictions for different τ, and simulation results for the same soft disk and SPV model simulations as in f. e Mean velocity magnitude for the experiments, and the soft disk, dividing soft disk and SPV model simulations. f Numerical results for soft, soft dividing, and SPV model interactions (solid lines), and theoretical predictions (dashed lines) for the same τ = 2.5h, and v0 = 90 μmh−1 (see text). g Normalized velocity distribution from experiment (black with grey confidence interval), and the three simulated models.

