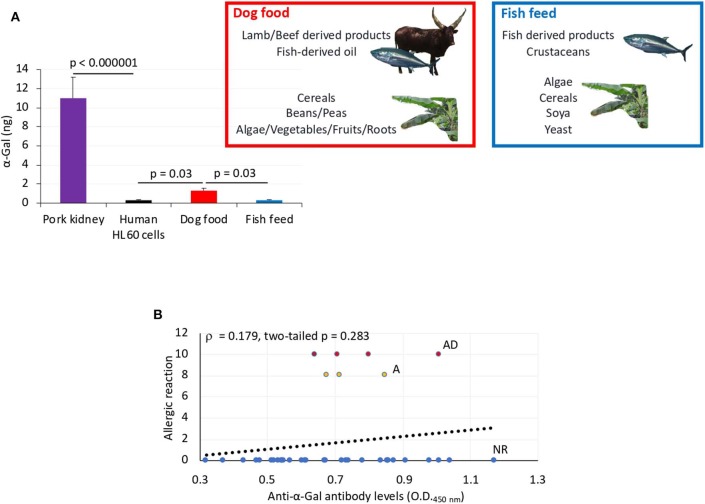
Figure 6.
α-Gal levels in dog food and fish feed and correlation analysis between anti–α-Gal IgM antibody levels and allergic reactions to tick saliva. (A) The α-Gal levels were determined by ELISA in fish feed and dog food and in comparison with pork kidney (α-Gal positive) and human HL60 cells (α-Gal negative) as positive and negative controls, respectively. The results were converted to α-Gal content per sample using a calibration curve (R2 = 0.992; Supplementary Figure 5A) and compared between samples and negative control and between dog food and fish feed by Student t-test with unequal variance (p < 0.05, N = 3 biological replicates). The main components of dog food and fish feed are shown. Only dog food contains α-Gal–positive animal-derived products. (B) Spearman ρ correlation analysis between anti–α-Gal IgM antibody levels and allergic reactions to tick saliva in Experiment 1 rated as 10 for fish with allergic reactions and death (AD), 8 for fish with allergic reactions only (A), and 0 for fish without reactions (NR). Correlation rank coefficient (ρ) and p-value are shown.

