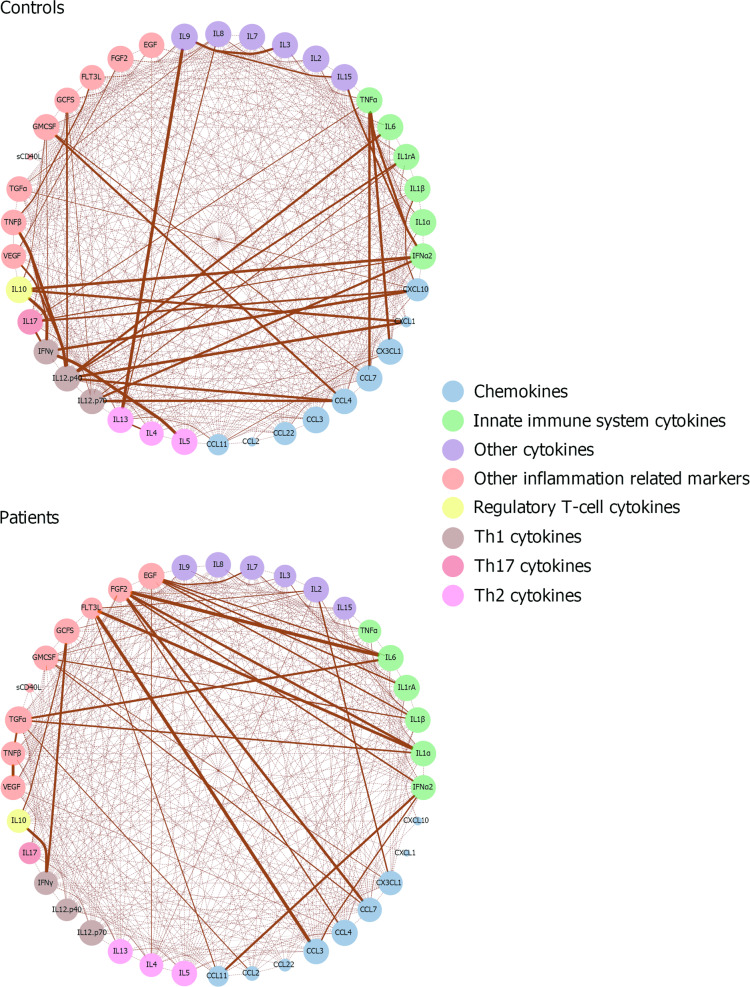
Fig. 1. Spearman’s rank correlation coefficient networks of cyto- and chemokines in patients and controls.
Correlations which are statistically significant after Bonferroni correction are presented. The strength of the line connecting two nodes (circles) reflects the degree of correlation, and the size of node for each cyto-and chemokine reflect the number and strength of correlations they have with other cyto- and chemokines. The nodes are grouped by color to structurally or functionally similar signaling molecules.

