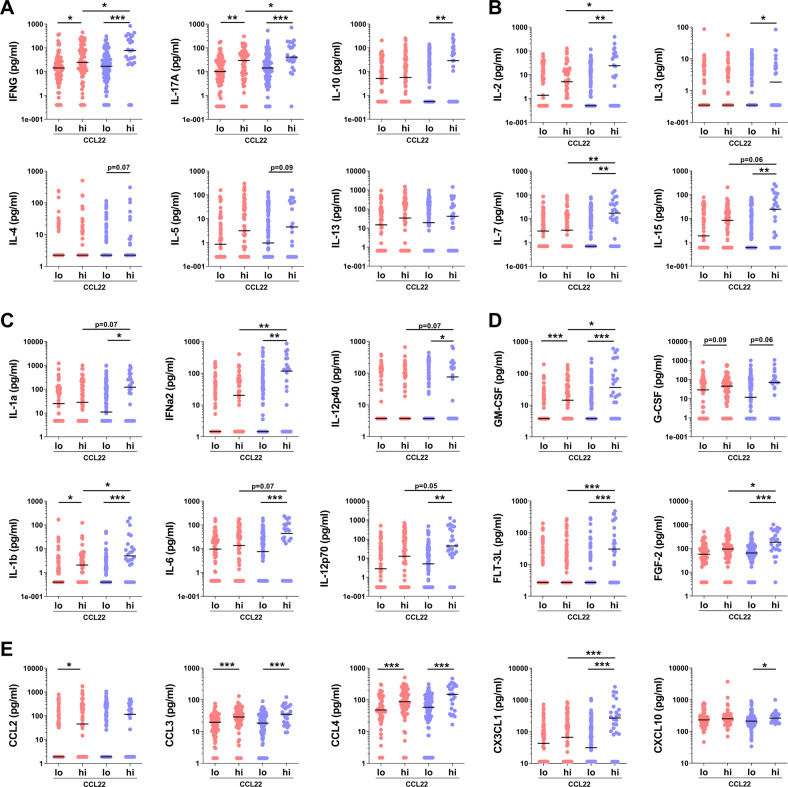
Fig. 2. Cytokine, chemokine and growth factor concentration in FEP patients (red circles) and in control subjects with low or high CCL22.
a Type cytokines of Th1, Th17 and Th2 cells and Tregs, b cytokines regulating T-cell activity and proliferation, c innate immunity cytokines, d growth factors and e chemokines. Black horizontal lines represents the median values. Y-axis show concentrations in logarithmic scale for visualization purposes. Linear concentration values were used to calculate p values using the Wilcoxon two sample test. *p < 0.05, **p < 0.01 and ***p < 0.001.

