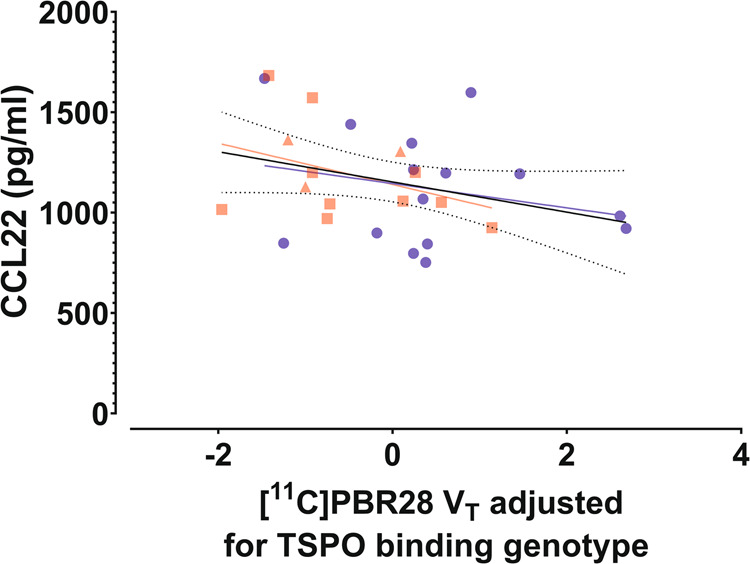
Fig. 6. Association of brain [11C]PBR28 VT to serum CCL22 level.

Total GM VT of [11C]PBR28, adjusted for the effect of TSPO binding genotype, is shown plotted against peripheral blood serum concentrations of CCL22 in first episode psychosis patients (FEP; red squares for non-affective psychoses, n = 10; red triangles for affective psychoses, n = 3) and healthy controls (HC; blue squares, n = 15). A simple linear regression was used to test for association of adjusted VT and CCL22 concentration in the whole sample, and both groups separately. A trend level statistically significant linear effect was found in the combined sample (F(1,26) = 3.017, p = 0.09), with an R2 of 0.104. The solid black line represents the linear regression line and the dotted black lines show the 95% confidence intervals of the fit. The best fit linear regression lines of the FEP and HC groups are shown as red and blue lines, respectively.
