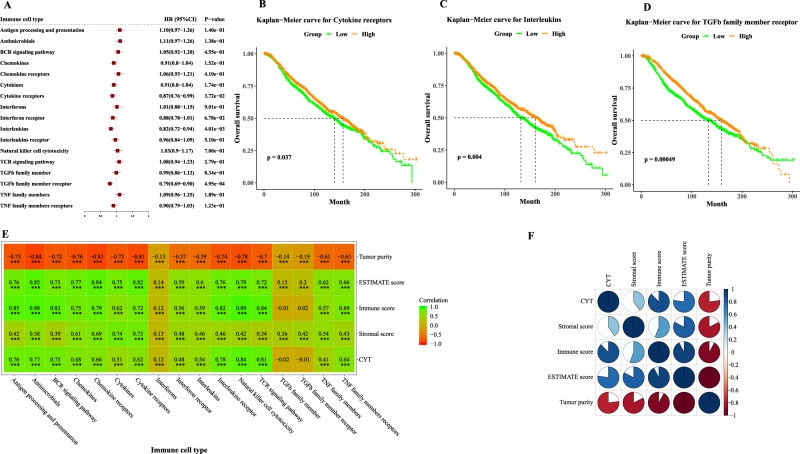
Figure 1.
The immune landscape of 17 immune cell types. (A) Forest plot visualizing hazard ratios (HRs) with 95% CI and P-values for 17 immune cell types. Kaplan-Meier survival curves by high and low tumor infiltrating levels for (B) cytokine receptors, (C) interleukins and (D) TGFb family member receptor. (E) The spearman’s correlation between the tumor infiltrating levels of 17 immune cell types and tumor purity, ESTIMATE score, stromal score, immune score and CYT. Statistical significance at the level of null ≥0.05, * < 0.05, ** < 0.01 and *** < 0.001. (F) The Spearman’s correlation between tumor purity, ESTIMATE score, stromal score, immune score and CYT.

