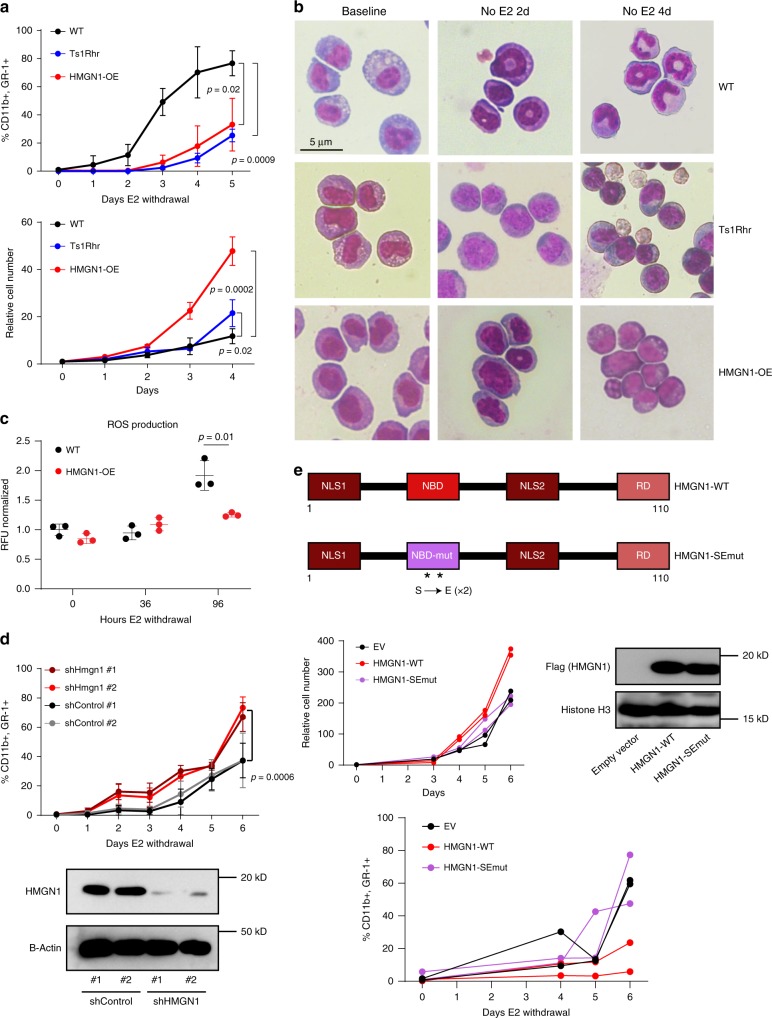
Fig. 1. HMGN1 overexpression impairs myeloid differentiation.
a Analysis of myeloid differentiation (upper) and proliferation (lower) in wild type, Ts1Rhr, and HMGN1-OE myeloid progenitors. Differentiation was measured after withdrawal of E2 as percentage of cells expressing CD11b and GR-1. b Representative morphology of progenitors at baseline, 2, and 4 days after withdrawal of E2. c Analysis of reactive oxygen species (ROS) production during differentiation. Plot is represented as relative fluoresce units (RFU) normalized to wild type at time 0. d Myeloid differentiation with or without shRNA knockdown of Hmgn1 in Ts1Rhr cells, Data compared by two-sided t test between control and Hmgn1 hairpins. Western blot for HMGN1 96 h after induction of the indicated shRNAs. e (Upper) Schematic representation of HMGN1-WT and HMGN1-SEmut (nucleosome binding domain (NBD) mutant harboring S20E and S24E mutations). NLS nuclear localization signal, RD relaxation domain. Proliferation (middle) and differentiation (lower) assays were measured as in panel a) in wild-type cells expressing the indicated proteins (EV empty vector). Western blot reflects expression of FLAG-HMGN1-WT and FLAG-HMGN1-SEmut. In all panels, graphs represent n = 3 biologically independent samples, except panel e, which is biologically independent duplicates. Conditions compared by two-sided t test. Data are presented as mean values ± SD. Source data are provided as a Source Data file.

