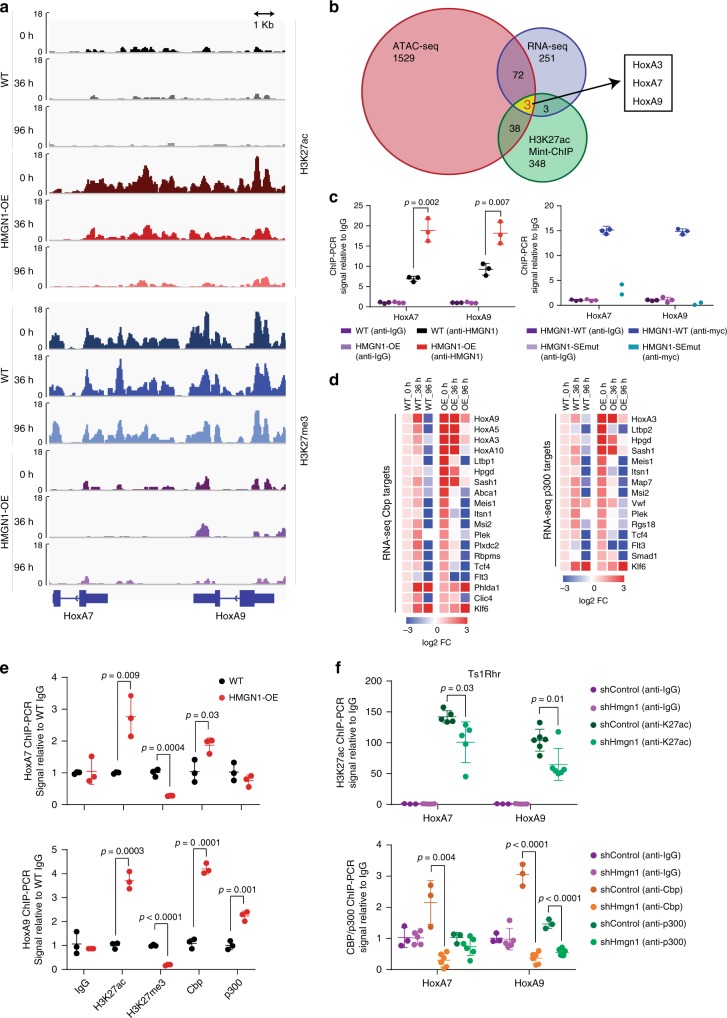
Fig. 3. Chromatin and expression changes of Hox genes linked to HMGN1 are associated with the histone acetyl transferases (HATs) Cbp and p300.
a Gene tracks showing H3K27ac and H3K27me3 Mint-ChIP reads at the HoxA7 and HoxA9 loci at baseline and during differentiation in wild-type and HMGN1-OE progenitors. b Venn diagram overlapping RNA-seq, H3K27ac Mint-ChIP, and ATAC-seq sets of significant differences in HMGN1-OE vs. wild-type progenitors at baseline (log2FC > 1.2, p < 0.05). c ChIP-PCR in wild-type and HMGN1-OE myeloid progenitors (left) and wild-type progenitors overexpressing either myc-tagged HMGN1-WT or HMGN1-SEmut (right) for relative HMGN1 binding in the HoxA7 and HoxA9 loci. n = 2 or 3 biologically independent samples, as indicated. d Heatmap of expression of CBP (left) and p300 (right) target genes that are members of the Wong_Adult_Tissue_Stem_Cell gene set and enriched in HMGN1-OE progenitors, expressed as log2 fold change (FC) relative to WT_0 h. e ChIP-PCR in wild-type and HMGN1-OE myeloid progenitors for relative H3K27ac, H3K27me3, Cbp, and p300 binding in the HoxA7 and HoxA9 loci. n = 3 biologically independent samples. f ChIP-PCR in Ts1Rhr progenitors with Hmgn1 knockdown by shRNA for relative H3K27ac (top) and the HATs Cbp and p300 (bottom) in the HoxA7 and HoxA9 loci. n = 3 biologically independent samples, each measured once (conditions with three data points) or twice (six data points). All statistical comparisons are by two-sided t test. Data are presented as mean values ± SD. Source data are provided as a Source Data file.

