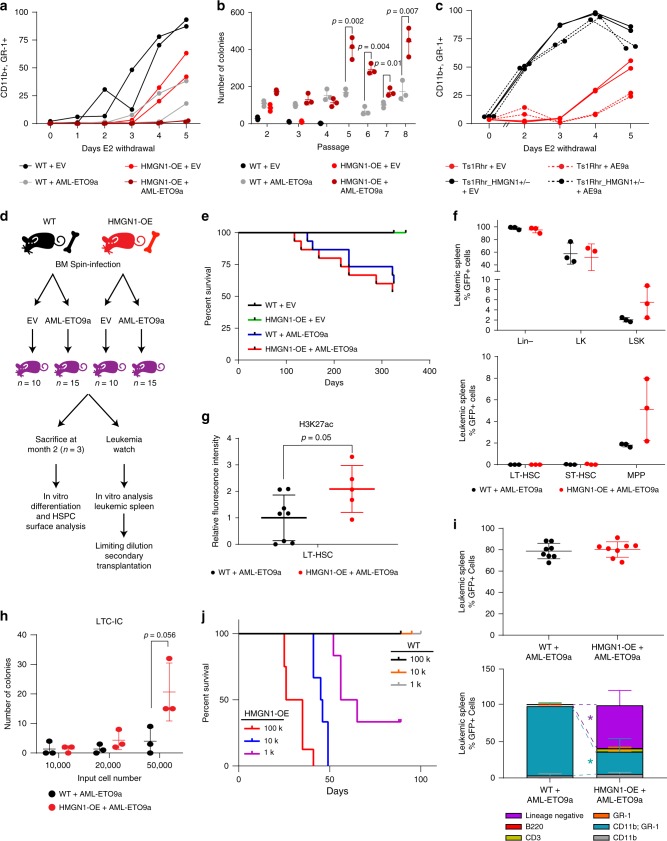
Fig. 5. HMGN1 overexpression enhances LSC activity in AML-ETO9a-transformed leukemias.
a Analysis of myeloid differentiation by flow cytometry for CD11b and GR-1 in GFP+ wild-type and HMGN1-OE myeloid progenitors transduced with empty vector (EV) or AML-ETO9a-expressing retrovirus, each co-expressing GFP. n = 2 biologically independent cultures. b Serial replating assays of wild-type and HMGN1-OE cells transduced with AML-ETO9a or EV. n = 3 biologically independent replicates. c Analysis of myeloid differentiation by flow cytometry for CD11b and GR-1 in myeloid progenitors from Ts1Rhr (3 copies of Hmgn1) or Ts1Rhr_HMGN1+/− (2 copies of Hmgn1 but 3 copies of the other 30 genes in the Ts1Rhr triplication), each transduced with AML-ETO9a or EV. n = 2 biologically independent replicates. d Schematic of the experimental approach for AML-ETO9a in vivo leukemia studies. e Survival of primary recipients of wild-type or HMGN1-OE marrow transduced with AML-ETO9a or empty vector (EV). f Flow cytometry of HSPC phenotypes within GFP+ cells in spleens from moribund recipients of wild-type + AML-ETO9a or HMGN1-OE + AML-ETO9a transplants, n = 3 independent animals. g Quantification of H3K27ac levels by flow cytometry in the LT-HSC subpopulation of moribund animals’ leukemias, n = 8 independent animals for wild-type + AML-ETO9a; n = 5 independent animals for HMGN1-OE + AML-ETO9a. h LTC-IC assays showing number of colony formation units (CFU) obtained from leukemic spleens from either AML-ETO9a wild-type or HMGN1-OE transplants, n = 3 independent animals. i Quantification of GFP+ levels and cell surface markers for subpopulations within GFP+ cells in the peripheral blood 4 weeks after secondary transplantation of 100,000 GFP+ splenocytes of the indicated genotypes, n = 8 independent animals. *p < 0.0001 comparing lineage negative or CD11b+/GR-1+ populations between genotypes. j Survival after limiting dilution secondary transplantation of wild-type + AML-ETO9a or HMGN1-OE + AML-ETO9a leukemia cells at the indicated cell doses (100 k n = 8 independent animals; 10 k n = 6; 1 k n = 6, each representing two independent leukemias of each genotype). In all cases, samples compared by two-sided t test. Data are presented as mean values ± SD. Source data are provided as a Source Data file.

