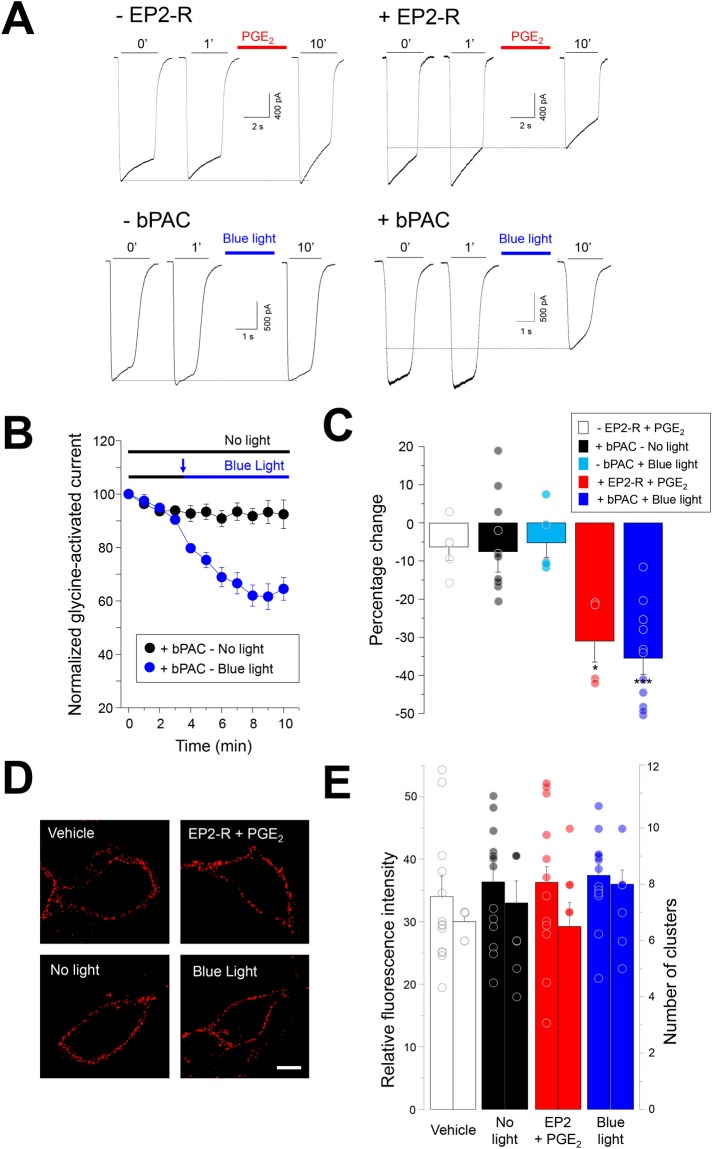
Figure 1.
Functional inhibition of wild-type α3GlyRs by cAMP signaling. (A) Current traces from cells expressing α3GlyRs alone or together with EP2 receptors or with bPAC. Sample traces were obtained after 0, 1 and 10 minutes (‘) of recording. (B) Time course of glycine-evoked currents (500 μM) in the absence and presence of blue light in cells co-expressing α3GlyRs and bPAC. (C) Summary of the glycine-activated current inhibition elicited by EP2 receptor activation with PGE2 (n = 4, red) or by bPAC stimulation with blue light (n = 11, blue) after 10 minutes of recording. Control conditions (PGE2 without the expression of EP2 receptors (n = 5, white), +bPAC under no light conditions (n = 10, black) and cells stimulated with blue light without bPAC expressed (n = 5, cyan) are also shown. Differences were significant between the groups treated with PGE2 (*P < 0.05) and between the groups expressing bPAC (***P < 0.001). ANOVA followed by Bonferroni post-hoc test, F(4, 34) = 8.99. (D) Plasma membrane expression of α3GlyRs after EP2 receptor activation or after bPAC stimulation with blue light. Calibration bar, 5 μm. (E) The graph shows the quantification of the receptor-associated signals (left) and number of receptor clusters (right). Differences were not significant, (Fluorescence intensity, F(3, 51) = 0.25; number of receptor clusters, F(3, 31) = 1.1). Relative fluorescence intensity: control (vehicle), n = 13; no light, n = 13; EP2 + PGE2, n = 12; blue light, n = 14. Number of clusters: control (vehicle), n = 8; no light, n = 8; EP2 + PGE2, n = 8; blue light, n = 8.

