Figure 3.
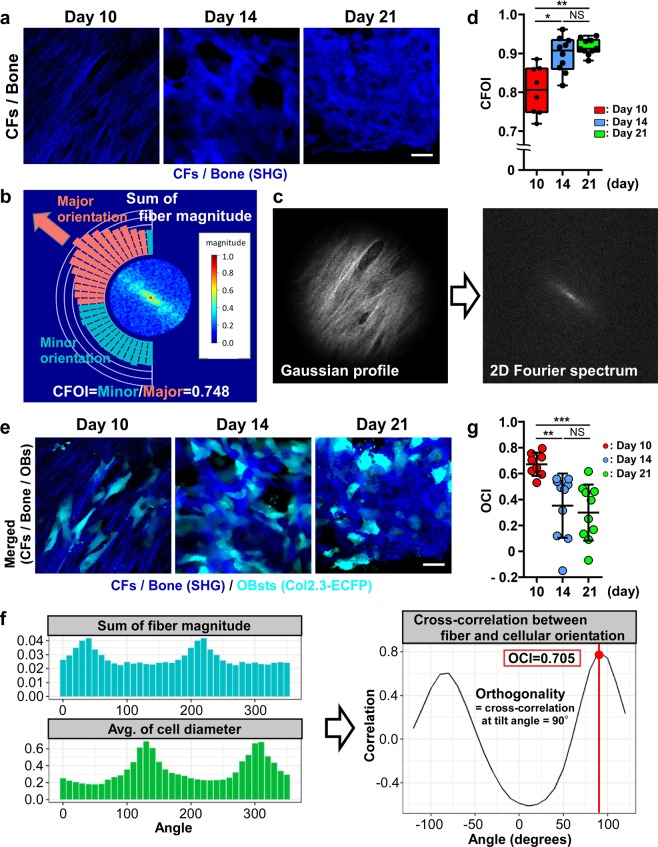
Changes in the orientation of CFs and OBs during ectopic bone formation. (a) Temporal change in CF formation in Col2.3-ECFP mice from day 10 to day 21. Blue: CFs/bone (SHG). Scale bar, 25 μm. (b–d) Image-analysis method for CFOI calculation based on Fourier transformation. (b) Example of CFOI calculation for the day 10 image shown with cylindrical Fourier spectrum. The normalized magnitude of the spectrum is shown in a color-coded form. Our method calculates the sum of the magnitude for each angle (shown by the bar plot) and searches the direction of the major orientation; once the major orientation is decided, the sums of the magnitude in the major orientation (red bars) and minor orientation (cyan bars) are obtained and their ratio is calculated. The CFOI value here of 0.748 indicates parallel orientation of the CFs. The image was created by R (version 3.5.0, https://www.r-project.org/). (c) Images of only SHG channels [day 10 image in (a)] were converted to grayscale (left panel). Power spectrum was obtained using 2D Fourier transformation (right panel). (d) CFOI from day 10 to day 21 after CS implantation. n = 8–10, representative of images collected from 4–5 mice/group. (e) Temporal change of CF and OB orientations in Col2.3-ECFP mice from day 10 to day 21. Blue: CFs/bone (SHG); cyan: OBs expressing Col2.3-ECFP. Scale bar, 25 μm. (f,g) Image analysis method for quantifying CF orientation against OB orientation based on cross-correlation. (f) OCI calculated for the image shown in (b) and the image shown in (c). The OCI value of 0.705 indicates that CF and OB orientations are both anisotropic. (g) OCI from day 10 to day 21 after CS implantation. n = 8–10, representative of images collected from 4–5 mice/group. Data are presented as means ± SD. *P < 0.05; **P < 0.01; ***P < 0.001; NS, not significant (Kruskal-Wallis test).

