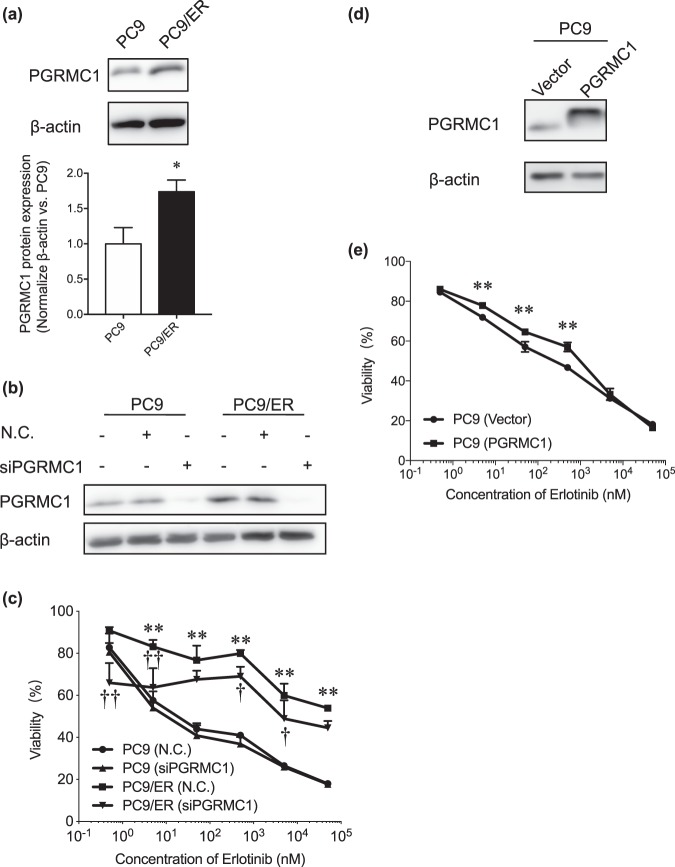
Figure 1.
Contribution of PGRMC1 to the resistance to erlotinib in lung adenocarcinomas cancer. (a) Immunoblotting of PGRMC1 in PC9 and PC9/ER cells. The upper panel shows a representative blot. The lower panel shows means ± SD (n = 3); *P < 0.05 vs. PC9 (two-tailed Student t-test). (b) Immunoblotting analysis of the efficiency of transfection of PC9 and PC9/ER cells with PGRMC1 siRNA (siPGRMC1). NC, negative control. The results shown are representative of 2 independent experiments. (c) WST-8 assay of the effects of various concentrations of erlotinib on cell viability of PGRMC1 siRNA–treated PC9 and PC9/ER cells. Data are means ± SD (n = 3); **P < 0.01, *P < 0.05 vs. PC9 (negative control); †P < 0.05, ††P < 0.01 vs. PC9/ER (negative control) (Two-Way ANOVA followed by Tukey correction). NC, negative control. (d) Immunoblotting analysis of the efficiency of transfection of PC9 cells with a PGRMC1-expressing plasmid. (e) WST-8 assay of the effects of various concentrations of erlotinib on PC9 cells transfected with empty vector or pCMV3-PGRMC1. Data are means ± SD (n = 3); **P < 0.01 vs. PC9 with empty vector (Two-Way ANOVA followed by Bonferroni correction).

